Venezuelan vs Barbadian In Labor Force | Age > 16
COMPARE
Venezuelan
Barbadian
In Labor Force | Age > 16
In Labor Force | Age > 16 Comparison
Venezuelans
Barbadians
66.3%
IN LABOR FORCE | AGE > 16
99.8/ 100
METRIC RATING
63rd/ 347
METRIC RANK
65.0%
IN LABOR FORCE | AGE > 16
33.9/ 100
METRIC RATING
190th/ 347
METRIC RANK
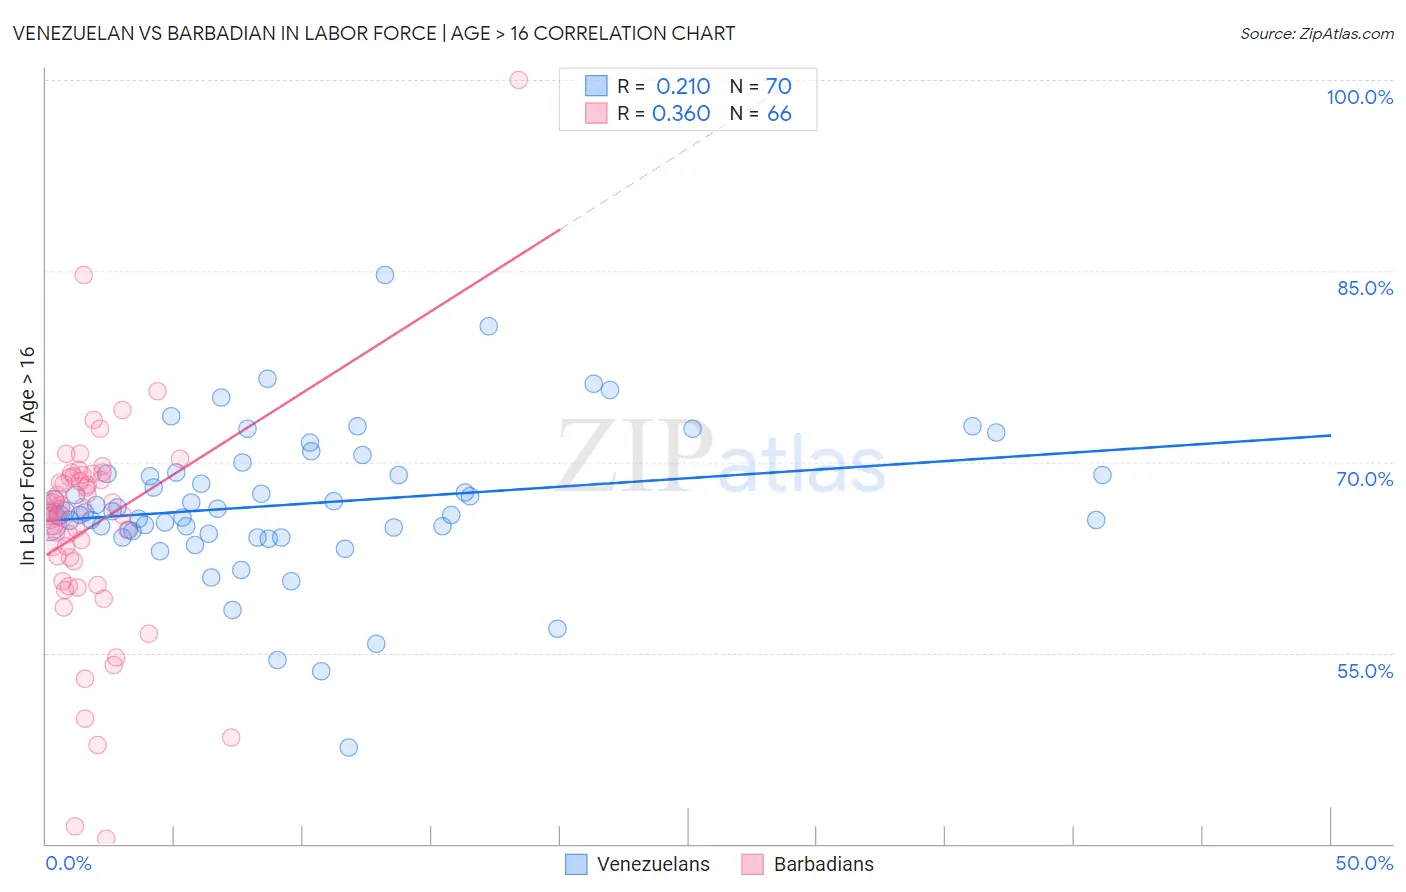
Venezuelan vs Barbadian In Labor Force | Age > 16 Correlation Chart
The statistical analysis conducted on geographies consisting of 306,338,840 people shows a weak positive correlation between the proportion of Venezuelans and labor force participation rate among population ages 16 and over in the United States with a correlation coefficient (R) of 0.210 and weighted average of 66.3%. Similarly, the statistical analysis conducted on geographies consisting of 141,304,779 people shows a mild positive correlation between the proportion of Barbadians and labor force participation rate among population ages 16 and over in the United States with a correlation coefficient (R) of 0.360 and weighted average of 65.0%, a difference of 2.0%.
In Labor Force | Age > 16 Correlation Summary
| Measurement | Venezuelan | Barbadian |
| Minimum | 47.6% | 40.4% |
| Maximum | 84.7% | 100.0% |
| Range | 37.1% | 59.6% |
| Mean | 66.7% | 64.9% |
| Median | 66.1% | 66.1% |
| Interquartile 25% (IQ1) | 64.6% | 62.2% |
| Interquartile 75% (IQ3) | 69.1% | 68.8% |
| Interquartile Range (IQR) | 4.5% | 6.6% |
| Standard Deviation (Sample) | 5.8% | 8.7% |
| Standard Deviation (Population) | 5.8% | 8.6% |
Similar Demographics by In Labor Force | Age > 16
Demographics Similar to Venezuelans by In Labor Force | Age > 16
In terms of in labor force | age > 16, the demographic groups most similar to Venezuelans are Peruvian (66.3%, a difference of 0.0%), Sri Lankan (66.3%, a difference of 0.010%), Jordanian (66.3%, a difference of 0.030%), Immigrants from Peru (66.3%, a difference of 0.040%), and Immigrants from Burma/Myanmar (66.3%, a difference of 0.040%).
| Demographics | Rating | Rank | In Labor Force | Age > 16 |
| Immigrants | Senegal | 99.9 /100 | #56 | Exceptional 66.4% |
| Bulgarians | 99.9 /100 | #57 | Exceptional 66.4% |
| Immigrants | Saudi Arabia | 99.9 /100 | #58 | Exceptional 66.3% |
| Immigrants | Turkey | 99.9 /100 | #59 | Exceptional 66.3% |
| Immigrants | Peru | 99.8 /100 | #60 | Exceptional 66.3% |
| Immigrants | Burma/Myanmar | 99.8 /100 | #61 | Exceptional 66.3% |
| Indonesians | 99.8 /100 | #62 | Exceptional 66.3% |
| Venezuelans | 99.8 /100 | #63 | Exceptional 66.3% |
| Peruvians | 99.8 /100 | #64 | Exceptional 66.3% |
| Sri Lankans | 99.8 /100 | #65 | Exceptional 66.3% |
| Jordanians | 99.8 /100 | #66 | Exceptional 66.3% |
| Egyptians | 99.8 /100 | #67 | Exceptional 66.2% |
| Immigrants | Egypt | 99.7 /100 | #68 | Exceptional 66.2% |
| Sub-Saharan Africans | 99.7 /100 | #69 | Exceptional 66.2% |
| Asians | 99.7 /100 | #70 | Exceptional 66.2% |
Demographics Similar to Barbadians by In Labor Force | Age > 16
In terms of in labor force | age > 16, the demographic groups most similar to Barbadians are Immigrants from Greece (65.0%, a difference of 0.0%), Scandinavian (65.0%, a difference of 0.0%), Immigrants from Fiji (65.0%, a difference of 0.0%), Immigrants from Europe (65.0%, a difference of 0.0%), and Immigrants from Portugal (65.0%, a difference of 0.010%).
| Demographics | Rating | Rank | In Labor Force | Age > 16 |
| Soviet Union | 40.5 /100 | #183 | Average 65.0% |
| Carpatho Rusyns | 40.0 /100 | #184 | Average 65.0% |
| Syrians | 40.0 /100 | #185 | Average 65.0% |
| Immigrants | Switzerland | 38.2 /100 | #186 | Fair 65.0% |
| Immigrants | Croatia | 35.7 /100 | #187 | Fair 65.0% |
| Immigrants | Portugal | 34.8 /100 | #188 | Fair 65.0% |
| Immigrants | Greece | 34.3 /100 | #189 | Fair 65.0% |
| Barbadians | 33.9 /100 | #190 | Fair 65.0% |
| Scandinavians | 33.7 /100 | #191 | Fair 65.0% |
| Immigrants | Fiji | 33.7 /100 | #192 | Fair 65.0% |
| Immigrants | Europe | 33.6 /100 | #193 | Fair 65.0% |
| Immigrants | Southern Europe | 31.3 /100 | #194 | Fair 65.0% |
| Romanians | 31.1 /100 | #195 | Fair 65.0% |
| Haitians | 30.6 /100 | #196 | Fair 65.0% |
| Immigrants | Italy | 28.7 /100 | #197 | Fair 65.0% |