Immigrants from Croatia vs Barbadian In Labor Force | Age 30-34
COMPARE
Immigrants from Croatia
Barbadian
In Labor Force | Age 30-34
In Labor Force | Age 30-34 Comparison
Immigrants from Croatia
Barbadians
86.1%
IN LABOR FORCE | AGE 30-34
100.0/ 100
METRIC RATING
13th/ 347
METRIC RANK
84.6%
IN LABOR FORCE | AGE 30-34
36.7/ 100
METRIC RATING
182nd/ 347
METRIC RANK
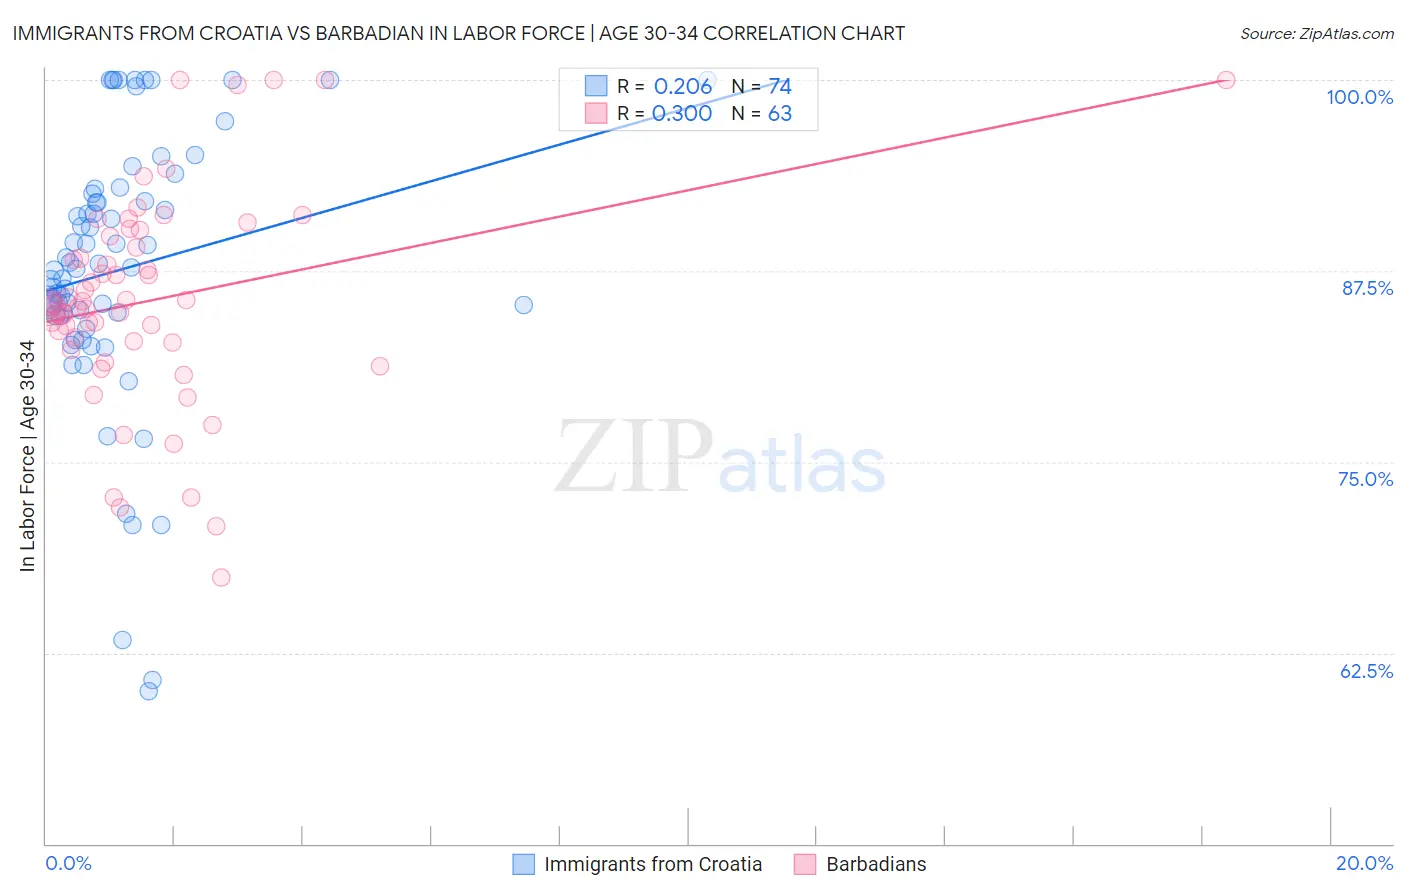
Immigrants from Croatia vs Barbadian In Labor Force | Age 30-34 Correlation Chart
The statistical analysis conducted on geographies consisting of 132,558,234 people shows a weak positive correlation between the proportion of Immigrants from Croatia and labor force participation rate among population between the ages 30 and 34 in the United States with a correlation coefficient (R) of 0.206 and weighted average of 86.1%. Similarly, the statistical analysis conducted on geographies consisting of 141,265,054 people shows a weak positive correlation between the proportion of Barbadians and labor force participation rate among population between the ages 30 and 34 in the United States with a correlation coefficient (R) of 0.300 and weighted average of 84.6%, a difference of 1.8%.
In Labor Force | Age 30-34 Correlation Summary
| Measurement | Immigrants from Croatia | Barbadian |
| Minimum | 60.0% | 67.5% |
| Maximum | 100.0% | 100.0% |
| Range | 40.0% | 32.5% |
| Mean | 87.6% | 85.6% |
| Median | 87.7% | 85.3% |
| Interquartile 25% (IQ1) | 84.6% | 82.8% |
| Interquartile 75% (IQ3) | 92.6% | 89.7% |
| Interquartile Range (IQR) | 8.0% | 6.9% |
| Standard Deviation (Sample) | 8.8% | 6.9% |
| Standard Deviation (Population) | 8.8% | 6.9% |
Similar Demographics by In Labor Force | Age 30-34
Demographics Similar to Immigrants from Croatia by In Labor Force | Age 30-34
In terms of in labor force | age 30-34, the demographic groups most similar to Immigrants from Croatia are Bolivian (86.1%, a difference of 0.0%), Immigrants from Cabo Verde (86.1%, a difference of 0.010%), Immigrants from Albania (86.1%, a difference of 0.030%), Latvian (86.0%, a difference of 0.060%), and Immigrants from Cameroon (86.0%, a difference of 0.060%).
| Demographics | Rating | Rank | In Labor Force | Age 30-34 |
| Somalis | 100.0 /100 | #6 | Exceptional 86.2% |
| Immigrants | Bolivia | 100.0 /100 | #7 | Exceptional 86.2% |
| Cambodians | 100.0 /100 | #8 | Exceptional 86.2% |
| Immigrants | Somalia | 100.0 /100 | #9 | Exceptional 86.2% |
| Immigrants | Serbia | 100.0 /100 | #10 | Exceptional 86.2% |
| Carpatho Rusyns | 100.0 /100 | #11 | Exceptional 86.2% |
| Bolivians | 100.0 /100 | #12 | Exceptional 86.1% |
| Immigrants | Croatia | 100.0 /100 | #13 | Exceptional 86.1% |
| Immigrants | Cabo Verde | 100.0 /100 | #14 | Exceptional 86.1% |
| Immigrants | Albania | 100.0 /100 | #15 | Exceptional 86.1% |
| Latvians | 100.0 /100 | #16 | Exceptional 86.0% |
| Immigrants | Cameroon | 100.0 /100 | #17 | Exceptional 86.0% |
| Immigrants | Sierra Leone | 100.0 /100 | #18 | Exceptional 86.0% |
| Sierra Leoneans | 100.0 /100 | #19 | Exceptional 86.0% |
| Bulgarians | 100.0 /100 | #20 | Exceptional 86.0% |
Demographics Similar to Barbadians by In Labor Force | Age 30-34
In terms of in labor force | age 30-34, the demographic groups most similar to Barbadians are Immigrants from Canada (84.6%, a difference of 0.010%), Moroccan (84.6%, a difference of 0.030%), Immigrants from North America (84.6%, a difference of 0.030%), Immigrants from Nigeria (84.6%, a difference of 0.040%), and Immigrants from Netherlands (84.6%, a difference of 0.040%).
| Demographics | Rating | Rank | In Labor Force | Age 30-34 |
| Immigrants | South America | 50.0 /100 | #175 | Average 84.7% |
| Immigrants | Uzbekistan | 49.1 /100 | #176 | Average 84.7% |
| Laotians | 46.9 /100 | #177 | Average 84.7% |
| Okinawans | 44.1 /100 | #178 | Average 84.6% |
| Immigrants | Nigeria | 42.5 /100 | #179 | Average 84.6% |
| Immigrants | Netherlands | 42.1 /100 | #180 | Average 84.6% |
| Moroccans | 40.3 /100 | #181 | Average 84.6% |
| Barbadians | 36.7 /100 | #182 | Fair 84.6% |
| Immigrants | Canada | 35.0 /100 | #183 | Fair 84.6% |
| Immigrants | North America | 33.3 /100 | #184 | Fair 84.6% |
| Immigrants | Philippines | 31.5 /100 | #185 | Fair 84.6% |
| Immigrants | Congo | 29.7 /100 | #186 | Fair 84.6% |
| Costa Ricans | 29.6 /100 | #187 | Fair 84.6% |
| Taiwanese | 29.4 /100 | #188 | Fair 84.6% |
| Nigerians | 28.9 /100 | #189 | Fair 84.5% |