Immigrants from Costa Rica vs Cheyenne Family Households with Children
COMPARE
Immigrants from Costa Rica
Cheyenne
Family Households with Children
Family Households with Children Comparison
Immigrants from Costa Rica
Cheyenne
28.3%
FAMILY HOUSEHOLDS WITH CHILDREN
99.6/ 100
METRIC RATING
89th/ 347
METRIC RANK
27.4%
FAMILY HOUSEHOLDS WITH CHILDREN
35.1/ 100
METRIC RATING
196th/ 347
METRIC RANK
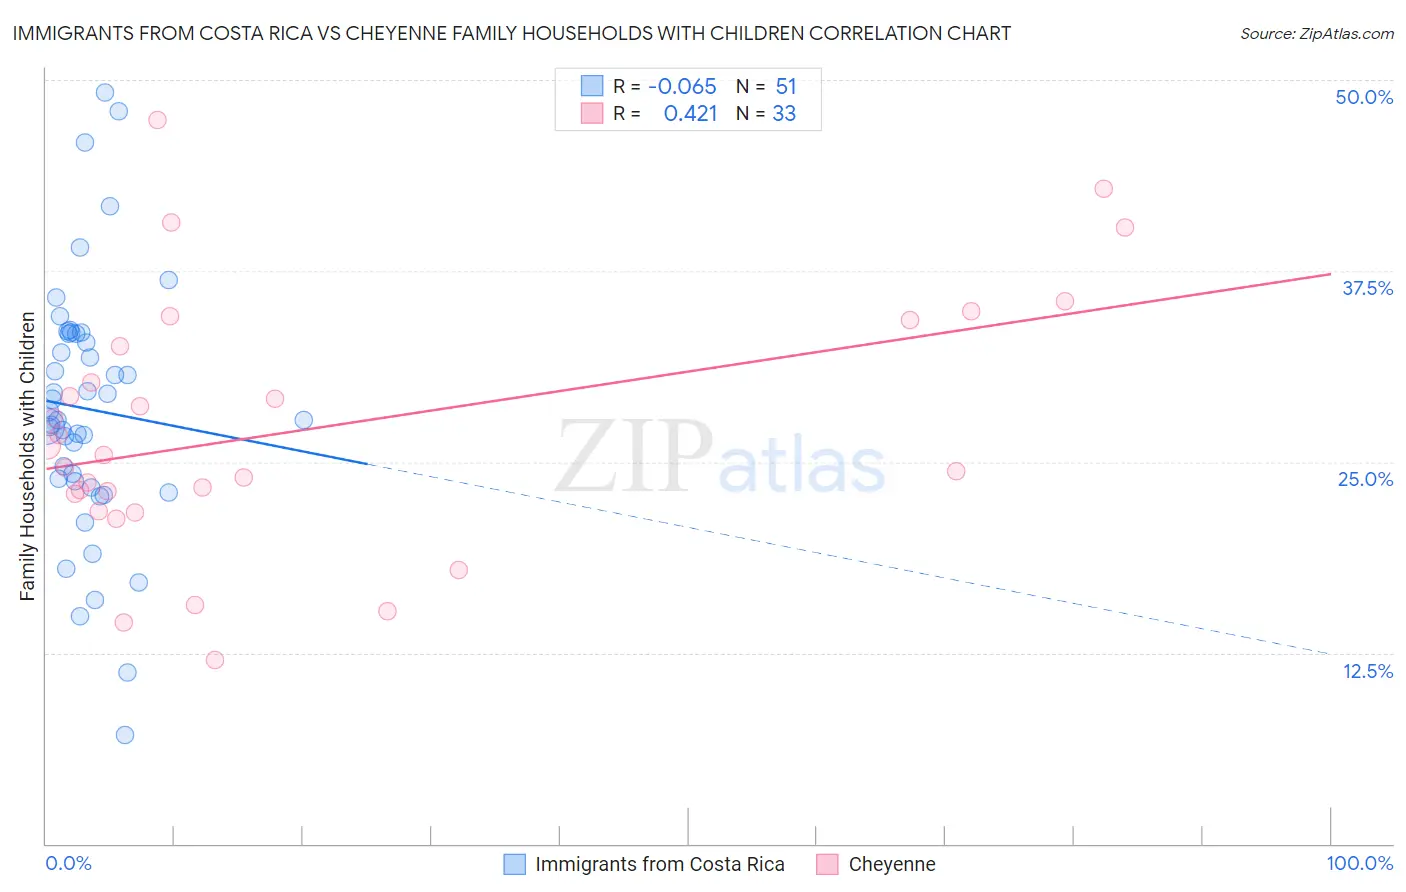
Immigrants from Costa Rica vs Cheyenne Family Households with Children Correlation Chart
The statistical analysis conducted on geographies consisting of 204,199,597 people shows a slight negative correlation between the proportion of Immigrants from Costa Rica and percentage of family households with children in the United States with a correlation coefficient (R) of -0.065 and weighted average of 28.3%. Similarly, the statistical analysis conducted on geographies consisting of 80,669,159 people shows a moderate positive correlation between the proportion of Cheyenne and percentage of family households with children in the United States with a correlation coefficient (R) of 0.421 and weighted average of 27.4%, a difference of 3.4%.
Family Households with Children Correlation Summary
| Measurement | Immigrants from Costa Rica | Cheyenne |
| Minimum | 7.1% | 12.0% |
| Maximum | 49.2% | 47.4% |
| Range | 42.0% | 35.3% |
| Mean | 28.5% | 27.1% |
| Median | 27.7% | 25.4% |
| Interquartile 25% (IQ1) | 23.7% | 22.4% |
| Interquartile 75% (IQ3) | 33.4% | 33.4% |
| Interquartile Range (IQR) | 9.7% | 11.1% |
| Standard Deviation (Sample) | 8.3% | 8.4% |
| Standard Deviation (Population) | 8.2% | 8.2% |
Similar Demographics by Family Households with Children
Demographics Similar to Immigrants from Costa Rica by Family Households with Children
In terms of family households with children, the demographic groups most similar to Immigrants from Costa Rica are Liberian (28.3%, a difference of 0.010%), Colombian (28.3%, a difference of 0.020%), Immigrants from Western Africa (28.3%, a difference of 0.080%), Immigrants from Thailand (28.2%, a difference of 0.10%), and Immigrants from Liberia (28.2%, a difference of 0.16%).
| Demographics | Rating | Rank | Family Households with Children |
| Kenyans | 99.8 /100 | #82 | Exceptional 28.4% |
| Nicaraguans | 99.8 /100 | #83 | Exceptional 28.4% |
| Costa Ricans | 99.8 /100 | #84 | Exceptional 28.4% |
| Immigrants | Syria | 99.8 /100 | #85 | Exceptional 28.4% |
| Immigrants | Western Africa | 99.6 /100 | #86 | Exceptional 28.3% |
| Colombians | 99.6 /100 | #87 | Exceptional 28.3% |
| Liberians | 99.6 /100 | #88 | Exceptional 28.3% |
| Immigrants | Costa Rica | 99.6 /100 | #89 | Exceptional 28.3% |
| Immigrants | Thailand | 99.5 /100 | #90 | Exceptional 28.2% |
| Immigrants | Liberia | 99.4 /100 | #91 | Exceptional 28.2% |
| Chickasaw | 99.4 /100 | #92 | Exceptional 28.2% |
| Panamanians | 99.3 /100 | #93 | Exceptional 28.2% |
| Immigrants | Colombia | 99.2 /100 | #94 | Exceptional 28.2% |
| Immigrants | Nicaragua | 99.1 /100 | #95 | Exceptional 28.2% |
| Ute | 99.1 /100 | #96 | Exceptional 28.2% |
Demographics Similar to Cheyenne by Family Households with Children
In terms of family households with children, the demographic groups most similar to Cheyenne are Norwegian (27.4%, a difference of 0.0%), Immigrants from Iran (27.4%, a difference of 0.020%), Crow (27.4%, a difference of 0.020%), Immigrants from Romania (27.4%, a difference of 0.020%), and Swedish (27.4%, a difference of 0.040%).
| Demographics | Rating | Rank | Family Households with Children |
| Immigrants | Israel | 37.9 /100 | #189 | Fair 27.4% |
| Immigrants | Uruguay | 37.7 /100 | #190 | Fair 27.4% |
| Sudanese | 37.6 /100 | #191 | Fair 27.4% |
| Pennsylvania Germans | 37.5 /100 | #192 | Fair 27.4% |
| Swedes | 36.9 /100 | #193 | Fair 27.4% |
| Immigrants | Iran | 36.1 /100 | #194 | Fair 27.4% |
| Crow | 35.7 /100 | #195 | Fair 27.4% |
| Cheyenne | 35.1 /100 | #196 | Fair 27.4% |
| Norwegians | 35.0 /100 | #197 | Fair 27.4% |
| Immigrants | Romania | 34.4 /100 | #198 | Fair 27.4% |
| English | 32.0 /100 | #199 | Fair 27.3% |
| Immigrants | Congo | 28.7 /100 | #200 | Fair 27.3% |
| Bhutanese | 25.1 /100 | #201 | Fair 27.3% |
| Americans | 22.8 /100 | #202 | Fair 27.3% |
| Kiowa | 22.2 /100 | #203 | Fair 27.3% |