Immigrants from Costa Rica vs Jordanian In Labor Force | Age 16-19
COMPARE
Immigrants from Costa Rica
Jordanian
In Labor Force | Age 16-19
In Labor Force | Age 16-19 Comparison
Immigrants from Costa Rica
Jordanians
35.6%
IN LABOR FORCE | AGE 16-19
10.7/ 100
METRIC RATING
217th/ 347
METRIC RANK
36.4%
IN LABOR FORCE | AGE 16-19
39.6/ 100
METRIC RATING
181st/ 347
METRIC RANK
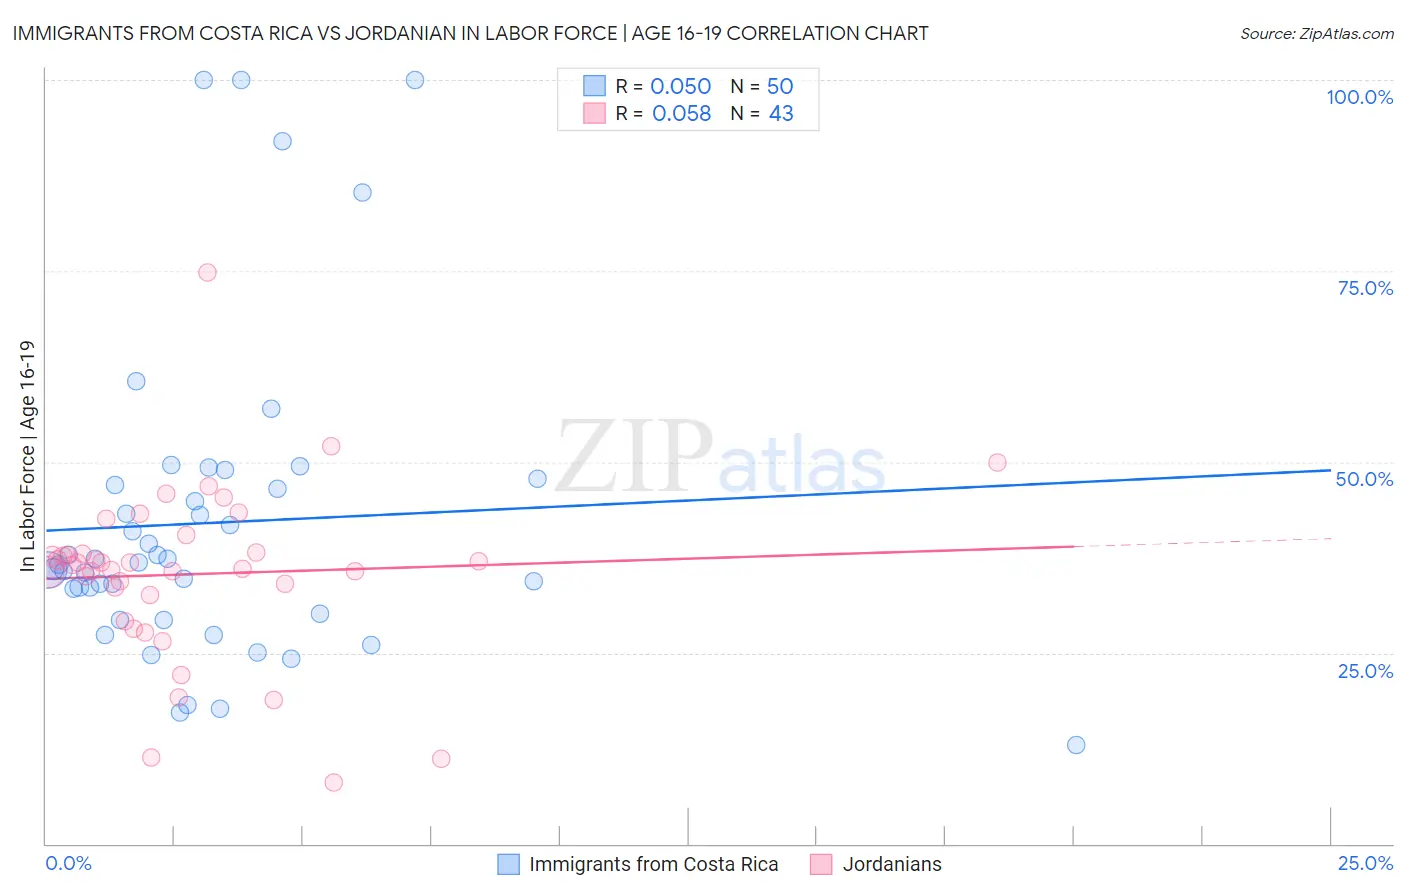
Immigrants from Costa Rica vs Jordanian In Labor Force | Age 16-19 Correlation Chart
The statistical analysis conducted on geographies consisting of 204,218,033 people shows a slight positive correlation between the proportion of Immigrants from Costa Rica and labor force participation rate among population between the ages 16 and 19 in the United States with a correlation coefficient (R) of 0.050 and weighted average of 35.6%. Similarly, the statistical analysis conducted on geographies consisting of 166,360,707 people shows a slight positive correlation between the proportion of Jordanians and labor force participation rate among population between the ages 16 and 19 in the United States with a correlation coefficient (R) of 0.058 and weighted average of 36.4%, a difference of 2.2%.
In Labor Force | Age 16-19 Correlation Summary
| Measurement | Immigrants from Costa Rica | Jordanian |
| Minimum | 13.0% | 8.0% |
| Maximum | 100.0% | 74.8% |
| Range | 87.0% | 66.8% |
| Mean | 42.0% | 35.3% |
| Median | 36.7% | 36.5% |
| Interquartile 25% (IQ1) | 30.1% | 32.5% |
| Interquartile 75% (IQ3) | 46.9% | 38.2% |
| Interquartile Range (IQR) | 16.9% | 5.7% |
| Standard Deviation (Sample) | 20.6% | 11.5% |
| Standard Deviation (Population) | 20.4% | 11.3% |
Similar Demographics by In Labor Force | Age 16-19
Demographics Similar to Immigrants from Costa Rica by In Labor Force | Age 16-19
In terms of in labor force | age 16-19, the demographic groups most similar to Immigrants from Costa Rica are Dutch West Indian (35.6%, a difference of 0.0%), Immigrants from South Eastern Asia (35.6%, a difference of 0.020%), Apache (35.6%, a difference of 0.040%), Houma (35.6%, a difference of 0.050%), and Immigrants from Bolivia (35.6%, a difference of 0.050%).
| Demographics | Rating | Rank | In Labor Force | Age 16-19 |
| Immigrants | Switzerland | 11.9 /100 | #210 | Poor 35.6% |
| Mexicans | 11.9 /100 | #211 | Poor 35.6% |
| Houma | 11.0 /100 | #212 | Poor 35.6% |
| Immigrants | Bolivia | 11.0 /100 | #213 | Poor 35.6% |
| Apache | 11.0 /100 | #214 | Poor 35.6% |
| Immigrants | South Eastern Asia | 10.8 /100 | #215 | Poor 35.6% |
| Dutch West Indians | 10.7 /100 | #216 | Poor 35.6% |
| Immigrants | Costa Rica | 10.7 /100 | #217 | Poor 35.6% |
| Sri Lankans | 9.8 /100 | #218 | Tragic 35.5% |
| Guatemalans | 8.6 /100 | #219 | Tragic 35.5% |
| Immigrants | Bahamas | 8.3 /100 | #220 | Tragic 35.5% |
| Turks | 7.3 /100 | #221 | Tragic 35.4% |
| Immigrants | Ghana | 7.3 /100 | #222 | Tragic 35.4% |
| Ghanaians | 6.5 /100 | #223 | Tragic 35.3% |
| Hondurans | 6.5 /100 | #224 | Tragic 35.3% |
Demographics Similar to Jordanians by In Labor Force | Age 16-19
In terms of in labor force | age 16-19, the demographic groups most similar to Jordanians are Immigrants from Italy (36.4%, a difference of 0.030%), Eastern European (36.4%, a difference of 0.040%), Immigrants from Morocco (36.4%, a difference of 0.080%), Costa Rican (36.3%, a difference of 0.19%), and Immigrants from Southern Europe (36.4%, a difference of 0.20%).
| Demographics | Rating | Rank | In Labor Force | Age 16-19 |
| Immigrants | Czechoslovakia | 50.0 /100 | #174 | Average 36.6% |
| Natives/Alaskans | 49.0 /100 | #175 | Average 36.6% |
| Albanians | 48.8 /100 | #176 | Average 36.5% |
| Immigrants | Northern Europe | 46.6 /100 | #177 | Average 36.5% |
| Blacks/African Americans | 45.1 /100 | #178 | Average 36.5% |
| Immigrants | Southern Europe | 43.3 /100 | #179 | Average 36.4% |
| Immigrants | Morocco | 41.1 /100 | #180 | Average 36.4% |
| Jordanians | 39.6 /100 | #181 | Fair 36.4% |
| Immigrants | Italy | 39.1 /100 | #182 | Fair 36.4% |
| Eastern Europeans | 38.8 /100 | #183 | Fair 36.4% |
| Costa Ricans | 36.1 /100 | #184 | Fair 36.3% |
| Bhutanese | 35.3 /100 | #185 | Fair 36.3% |
| Immigrants | Romania | 34.0 /100 | #186 | Fair 36.3% |
| Immigrants | Afghanistan | 34.0 /100 | #187 | Fair 36.3% |
| Immigrants | Europe | 31.8 /100 | #188 | Fair 36.2% |