Immigrants from Costa Rica vs Aleut In Labor Force | Age 16-19
COMPARE
Immigrants from Costa Rica
Aleut
In Labor Force | Age 16-19
In Labor Force | Age 16-19 Comparison
Immigrants from Costa Rica
Aleuts
35.6%
IN LABOR FORCE | AGE 16-19
10.7/ 100
METRIC RATING
217th/ 347
METRIC RANK
40.4%
IN LABOR FORCE | AGE 16-19
100.0/ 100
METRIC RATING
58th/ 347
METRIC RANK
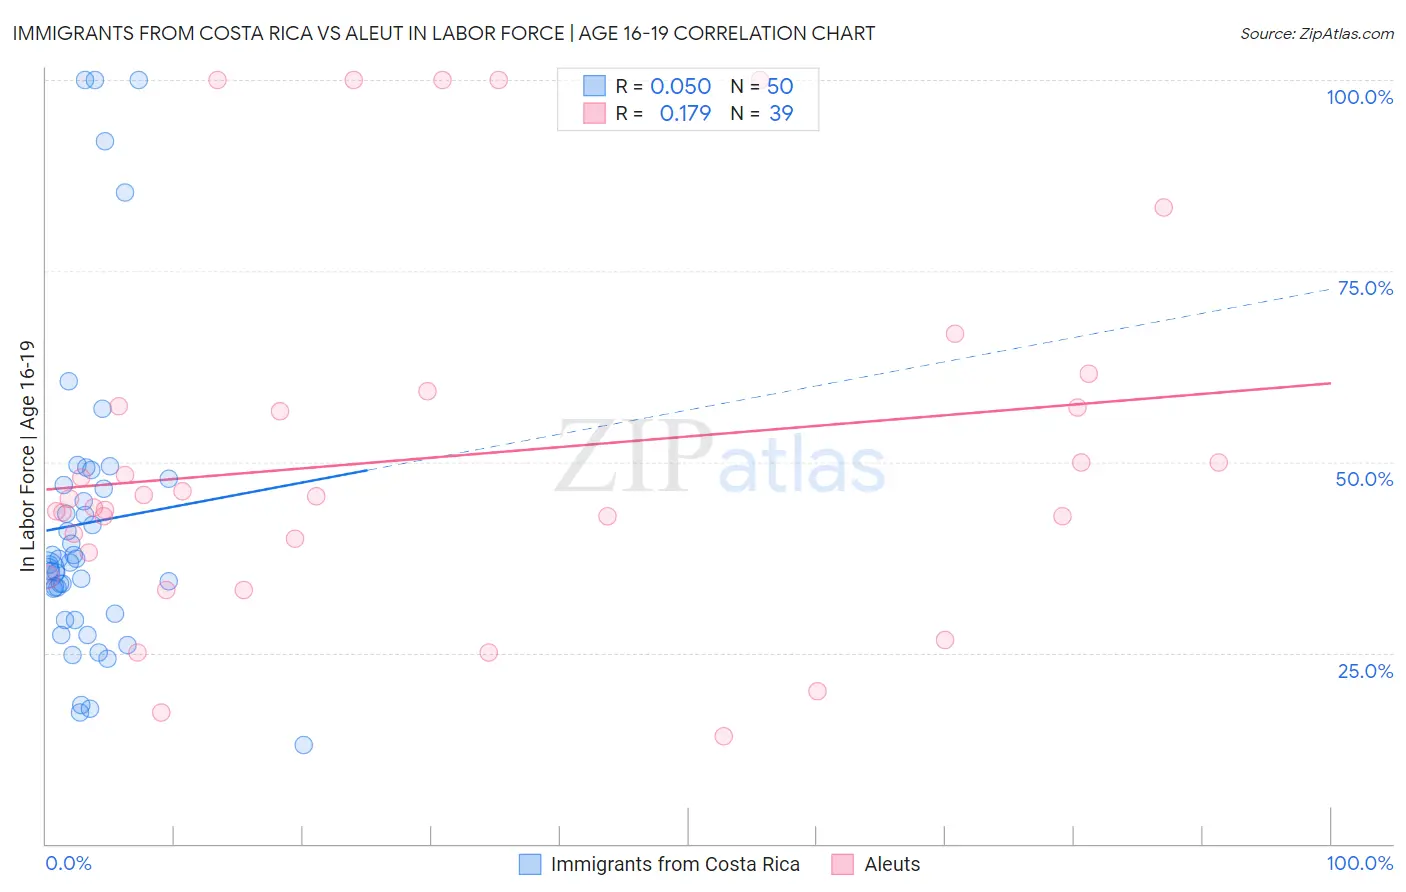
Immigrants from Costa Rica vs Aleut In Labor Force | Age 16-19 Correlation Chart
The statistical analysis conducted on geographies consisting of 204,218,033 people shows a slight positive correlation between the proportion of Immigrants from Costa Rica and labor force participation rate among population between the ages 16 and 19 in the United States with a correlation coefficient (R) of 0.050 and weighted average of 35.6%. Similarly, the statistical analysis conducted on geographies consisting of 61,744,567 people shows a poor positive correlation between the proportion of Aleuts and labor force participation rate among population between the ages 16 and 19 in the United States with a correlation coefficient (R) of 0.179 and weighted average of 40.4%, a difference of 13.6%.
In Labor Force | Age 16-19 Correlation Summary
| Measurement | Immigrants from Costa Rica | Aleut |
| Minimum | 13.0% | 14.1% |
| Maximum | 100.0% | 100.0% |
| Range | 87.0% | 85.9% |
| Mean | 42.0% | 50.6% |
| Median | 36.7% | 45.1% |
| Interquartile 25% (IQ1) | 30.1% | 38.2% |
| Interquartile 75% (IQ3) | 46.9% | 57.3% |
| Interquartile Range (IQR) | 16.9% | 19.1% |
| Standard Deviation (Sample) | 20.6% | 23.4% |
| Standard Deviation (Population) | 20.4% | 23.1% |
Similar Demographics by In Labor Force | Age 16-19
Demographics Similar to Immigrants from Costa Rica by In Labor Force | Age 16-19
In terms of in labor force | age 16-19, the demographic groups most similar to Immigrants from Costa Rica are Dutch West Indian (35.6%, a difference of 0.0%), Immigrants from South Eastern Asia (35.6%, a difference of 0.020%), Apache (35.6%, a difference of 0.040%), Houma (35.6%, a difference of 0.050%), and Immigrants from Bolivia (35.6%, a difference of 0.050%).
| Demographics | Rating | Rank | In Labor Force | Age 16-19 |
| Immigrants | Switzerland | 11.9 /100 | #210 | Poor 35.6% |
| Mexicans | 11.9 /100 | #211 | Poor 35.6% |
| Houma | 11.0 /100 | #212 | Poor 35.6% |
| Immigrants | Bolivia | 11.0 /100 | #213 | Poor 35.6% |
| Apache | 11.0 /100 | #214 | Poor 35.6% |
| Immigrants | South Eastern Asia | 10.8 /100 | #215 | Poor 35.6% |
| Dutch West Indians | 10.7 /100 | #216 | Poor 35.6% |
| Immigrants | Costa Rica | 10.7 /100 | #217 | Poor 35.6% |
| Sri Lankans | 9.8 /100 | #218 | Tragic 35.5% |
| Guatemalans | 8.6 /100 | #219 | Tragic 35.5% |
| Immigrants | Bahamas | 8.3 /100 | #220 | Tragic 35.5% |
| Turks | 7.3 /100 | #221 | Tragic 35.4% |
| Immigrants | Ghana | 7.3 /100 | #222 | Tragic 35.4% |
| Ghanaians | 6.5 /100 | #223 | Tragic 35.3% |
| Hondurans | 6.5 /100 | #224 | Tragic 35.3% |
Demographics Similar to Aleuts by In Labor Force | Age 16-19
In terms of in labor force | age 16-19, the demographic groups most similar to Aleuts are Lithuanian (40.4%, a difference of 0.010%), Fijian (40.4%, a difference of 0.040%), British (40.5%, a difference of 0.13%), Slavic (40.4%, a difference of 0.13%), and Tlingit-Haida (40.5%, a difference of 0.16%).
| Demographics | Rating | Rank | In Labor Force | Age 16-19 |
| Immigrants | Zaire | 100.0 /100 | #51 | Exceptional 40.7% |
| Immigrants | Laos | 100.0 /100 | #52 | Exceptional 40.6% |
| Immigrants | Kenya | 100.0 /100 | #53 | Exceptional 40.5% |
| Tlingit-Haida | 100.0 /100 | #54 | Exceptional 40.5% |
| British | 100.0 /100 | #55 | Exceptional 40.5% |
| Fijians | 100.0 /100 | #56 | Exceptional 40.4% |
| Lithuanians | 100.0 /100 | #57 | Exceptional 40.4% |
| Aleuts | 100.0 /100 | #58 | Exceptional 40.4% |
| Slavs | 100.0 /100 | #59 | Exceptional 40.4% |
| Immigrants | Eastern Africa | 100.0 /100 | #60 | Exceptional 40.4% |
| Americans | 100.0 /100 | #61 | Exceptional 40.3% |
| Cherokee | 100.0 /100 | #62 | Exceptional 40.2% |
| Northern Europeans | 100.0 /100 | #63 | Exceptional 40.2% |
| Immigrants | Micronesia | 100.0 /100 | #64 | Exceptional 40.2% |
| Kenyans | 100.0 /100 | #65 | Exceptional 40.1% |