Immigrants from Costa Rica vs Immigrants from Vietnam In Labor Force | Age 16-19
COMPARE
Immigrants from Costa Rica
Immigrants from Vietnam
In Labor Force | Age 16-19
In Labor Force | Age 16-19 Comparison
Immigrants from Costa Rica
Immigrants from Vietnam
35.6%
IN LABOR FORCE | AGE 16-19
10.7/ 100
METRIC RATING
217th/ 347
METRIC RANK
35.0%
IN LABOR FORCE | AGE 16-19
3.4/ 100
METRIC RATING
238th/ 347
METRIC RANK
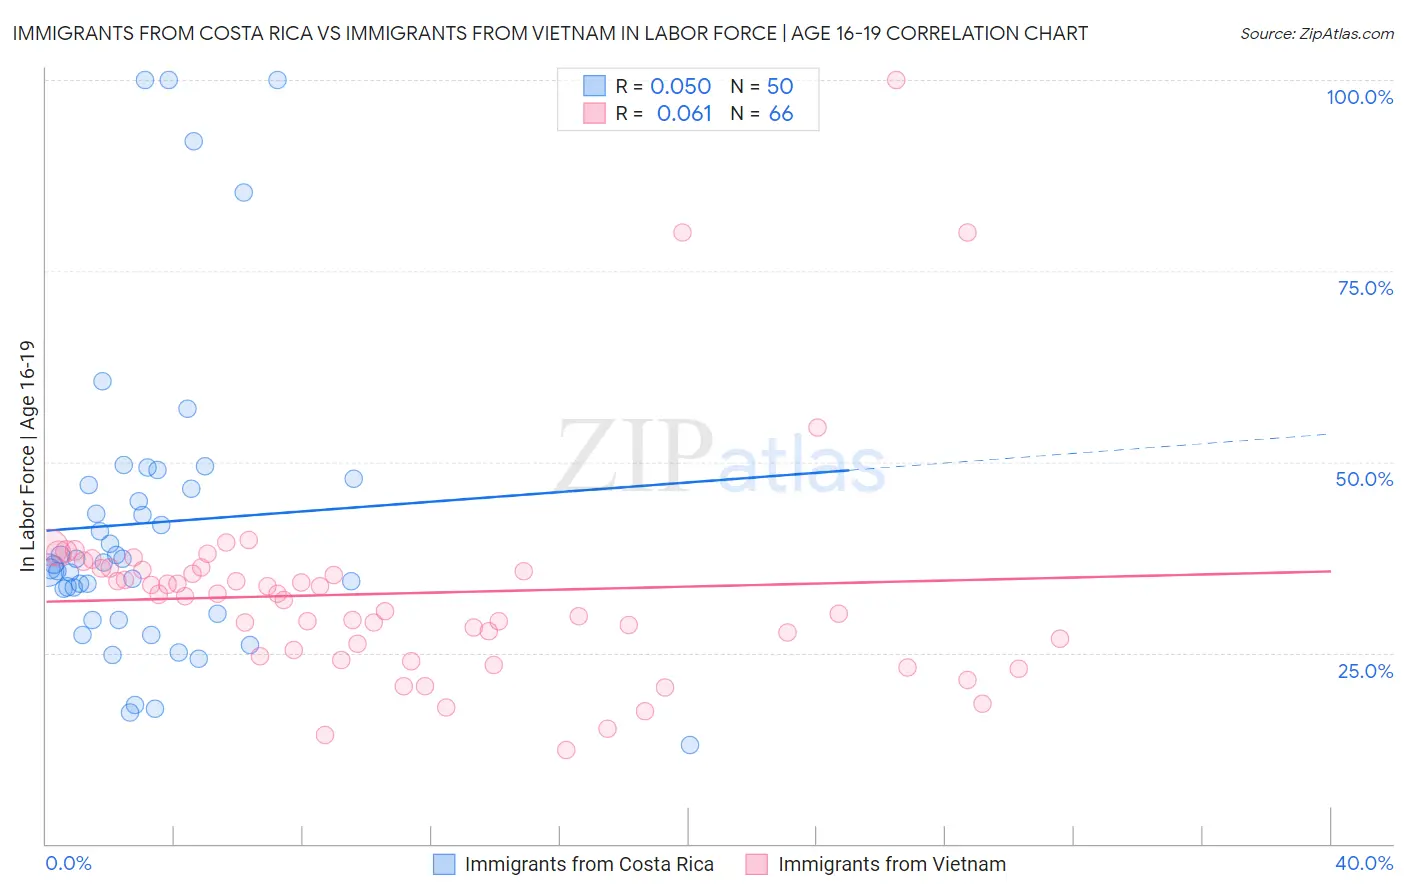
Immigrants from Costa Rica vs Immigrants from Vietnam In Labor Force | Age 16-19 Correlation Chart
The statistical analysis conducted on geographies consisting of 204,218,033 people shows a slight positive correlation between the proportion of Immigrants from Costa Rica and labor force participation rate among population between the ages 16 and 19 in the United States with a correlation coefficient (R) of 0.050 and weighted average of 35.6%. Similarly, the statistical analysis conducted on geographies consisting of 404,448,042 people shows a slight positive correlation between the proportion of Immigrants from Vietnam and labor force participation rate among population between the ages 16 and 19 in the United States with a correlation coefficient (R) of 0.061 and weighted average of 35.0%, a difference of 1.6%.
In Labor Force | Age 16-19 Correlation Summary
| Measurement | Immigrants from Costa Rica | Immigrants from Vietnam |
| Minimum | 13.0% | 12.3% |
| Maximum | 100.0% | 100.0% |
| Range | 87.0% | 87.7% |
| Mean | 42.0% | 32.8% |
| Median | 36.7% | 32.5% |
| Interquartile 25% (IQ1) | 30.1% | 25.3% |
| Interquartile 75% (IQ3) | 46.9% | 36.1% |
| Interquartile Range (IQR) | 16.9% | 10.7% |
| Standard Deviation (Sample) | 20.6% | 14.1% |
| Standard Deviation (Population) | 20.4% | 14.0% |
Similar Demographics by In Labor Force | Age 16-19
Demographics Similar to Immigrants from Costa Rica by In Labor Force | Age 16-19
In terms of in labor force | age 16-19, the demographic groups most similar to Immigrants from Costa Rica are Dutch West Indian (35.6%, a difference of 0.0%), Immigrants from South Eastern Asia (35.6%, a difference of 0.020%), Apache (35.6%, a difference of 0.040%), Houma (35.6%, a difference of 0.050%), and Immigrants from Bolivia (35.6%, a difference of 0.050%).
| Demographics | Rating | Rank | In Labor Force | Age 16-19 |
| Immigrants | Switzerland | 11.9 /100 | #210 | Poor 35.6% |
| Mexicans | 11.9 /100 | #211 | Poor 35.6% |
| Houma | 11.0 /100 | #212 | Poor 35.6% |
| Immigrants | Bolivia | 11.0 /100 | #213 | Poor 35.6% |
| Apache | 11.0 /100 | #214 | Poor 35.6% |
| Immigrants | South Eastern Asia | 10.8 /100 | #215 | Poor 35.6% |
| Dutch West Indians | 10.7 /100 | #216 | Poor 35.6% |
| Immigrants | Costa Rica | 10.7 /100 | #217 | Poor 35.6% |
| Sri Lankans | 9.8 /100 | #218 | Tragic 35.5% |
| Guatemalans | 8.6 /100 | #219 | Tragic 35.5% |
| Immigrants | Bahamas | 8.3 /100 | #220 | Tragic 35.5% |
| Turks | 7.3 /100 | #221 | Tragic 35.4% |
| Immigrants | Ghana | 7.3 /100 | #222 | Tragic 35.4% |
| Ghanaians | 6.5 /100 | #223 | Tragic 35.3% |
| Hondurans | 6.5 /100 | #224 | Tragic 35.3% |
Demographics Similar to Immigrants from Vietnam by In Labor Force | Age 16-19
In terms of in labor force | age 16-19, the demographic groups most similar to Immigrants from Vietnam are Immigrants from India (35.0%, a difference of 0.050%), Immigrants from Australia (35.1%, a difference of 0.070%), Inupiat (35.0%, a difference of 0.090%), Immigrants from Central America (35.0%, a difference of 0.19%), and Immigrants from Philippines (35.1%, a difference of 0.21%).
| Demographics | Rating | Rank | In Labor Force | Age 16-19 |
| Immigrants | Syria | 4.5 /100 | #231 | Tragic 35.2% |
| Immigrants | Kazakhstan | 4.5 /100 | #232 | Tragic 35.2% |
| Immigrants | France | 4.3 /100 | #233 | Tragic 35.1% |
| Immigrants | Mexico | 4.2 /100 | #234 | Tragic 35.1% |
| Immigrants | Philippines | 4.0 /100 | #235 | Tragic 35.1% |
| Immigrants | Australia | 3.6 /100 | #236 | Tragic 35.1% |
| Immigrants | India | 3.5 /100 | #237 | Tragic 35.0% |
| Immigrants | Vietnam | 3.4 /100 | #238 | Tragic 35.0% |
| Inupiat | 3.2 /100 | #239 | Tragic 35.0% |
| Immigrants | Central America | 3.0 /100 | #240 | Tragic 35.0% |
| Immigrants | Ireland | 2.9 /100 | #241 | Tragic 35.0% |
| Uruguayans | 2.6 /100 | #242 | Tragic 34.9% |
| Pueblo | 2.6 /100 | #243 | Tragic 34.9% |
| Immigrants | Turkey | 2.6 /100 | #244 | Tragic 34.9% |
| Immigrants | Greece | 2.4 /100 | #245 | Tragic 34.9% |