Immigrants from Afghanistan vs Immigrants from Lithuania In Labor Force | Age > 16
COMPARE
Immigrants from Afghanistan
Immigrants from Lithuania
In Labor Force | Age > 16
In Labor Force | Age > 16 Comparison
Immigrants from Afghanistan
Immigrants from Lithuania
67.0%
IN LABOR FORCE | AGE > 16
100.0/ 100
METRIC RATING
37th/ 347
METRIC RANK
65.6%
IN LABOR FORCE | AGE > 16
93.5/ 100
METRIC RATING
133rd/ 347
METRIC RANK
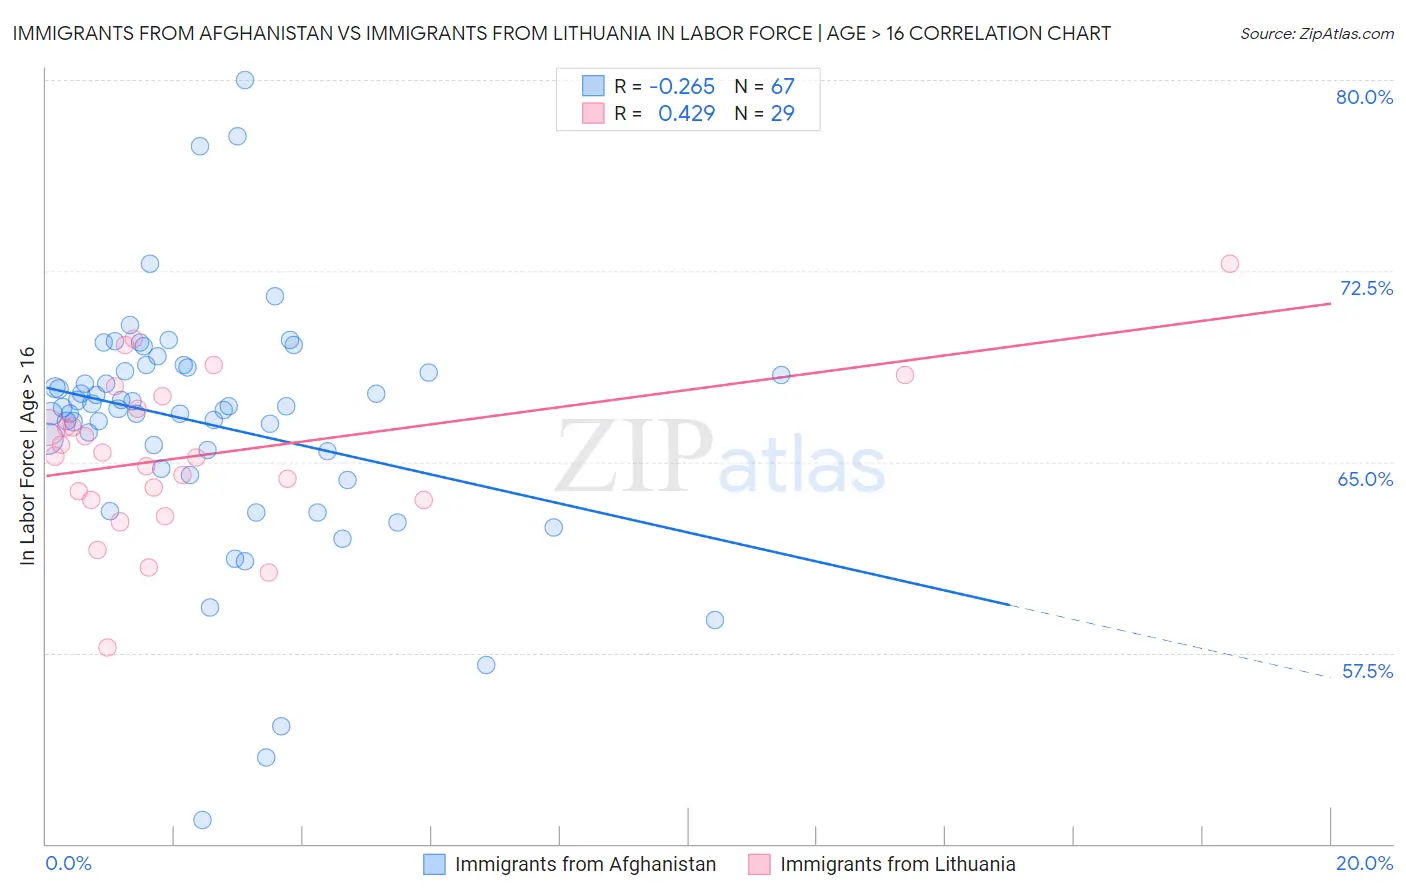
Immigrants from Afghanistan vs Immigrants from Lithuania In Labor Force | Age > 16 Correlation Chart
The statistical analysis conducted on geographies consisting of 147,646,039 people shows a weak negative correlation between the proportion of Immigrants from Afghanistan and labor force participation rate among population ages 16 and over in the United States with a correlation coefficient (R) of -0.265 and weighted average of 67.0%. Similarly, the statistical analysis conducted on geographies consisting of 117,714,489 people shows a moderate positive correlation between the proportion of Immigrants from Lithuania and labor force participation rate among population ages 16 and over in the United States with a correlation coefficient (R) of 0.429 and weighted average of 65.6%, a difference of 2.1%.
In Labor Force | Age > 16 Correlation Summary
| Measurement | Immigrants from Afghanistan | Immigrants from Lithuania |
| Minimum | 50.9% | 57.7% |
| Maximum | 80.0% | 72.8% |
| Range | 29.1% | 15.1% |
| Mean | 66.5% | 65.3% |
| Median | 67.1% | 65.2% |
| Interquartile 25% (IQ1) | 64.7% | 63.5% |
| Interquartile 75% (IQ3) | 68.7% | 67.3% |
| Interquartile Range (IQR) | 4.0% | 3.8% |
| Standard Deviation (Sample) | 4.8% | 3.1% |
| Standard Deviation (Population) | 4.8% | 3.1% |
Similar Demographics by In Labor Force | Age > 16
Demographics Similar to Immigrants from Afghanistan by In Labor Force | Age > 16
In terms of in labor force | age > 16, the demographic groups most similar to Immigrants from Afghanistan are Immigrants from South Central Asia (67.1%, a difference of 0.080%), Immigrants from Western Africa (67.1%, a difference of 0.080%), Immigrants from Nigeria (66.9%, a difference of 0.12%), Immigrants from Ghana (67.1%, a difference of 0.13%), and Immigrants from Congo (67.1%, a difference of 0.14%).
| Demographics | Rating | Rank | In Labor Force | Age > 16 |
| Immigrants | Zaire | 100.0 /100 | #30 | Exceptional 67.2% |
| Ghanaians | 100.0 /100 | #31 | Exceptional 67.1% |
| Immigrants | Congo | 100.0 /100 | #32 | Exceptional 67.1% |
| Afghans | 100.0 /100 | #33 | Exceptional 67.1% |
| Immigrants | Ghana | 100.0 /100 | #34 | Exceptional 67.1% |
| Immigrants | South Central Asia | 100.0 /100 | #35 | Exceptional 67.1% |
| Immigrants | Western Africa | 100.0 /100 | #36 | Exceptional 67.1% |
| Immigrants | Afghanistan | 100.0 /100 | #37 | Exceptional 67.0% |
| Immigrants | Nigeria | 100.0 /100 | #38 | Exceptional 66.9% |
| Salvadorans | 100.0 /100 | #39 | Exceptional 66.8% |
| Immigrants | El Salvador | 100.0 /100 | #40 | Exceptional 66.8% |
| Immigrants | Zimbabwe | 100.0 /100 | #41 | Exceptional 66.8% |
| Senegalese | 100.0 /100 | #42 | Exceptional 66.7% |
| Luxembourgers | 100.0 /100 | #43 | Exceptional 66.7% |
| Immigrants | Pakistan | 100.0 /100 | #44 | Exceptional 66.7% |
Demographics Similar to Immigrants from Lithuania by In Labor Force | Age > 16
In terms of in labor force | age > 16, the demographic groups most similar to Immigrants from Lithuania are Costa Rican (65.6%, a difference of 0.010%), Immigrants from North Macedonia (65.6%, a difference of 0.030%), Immigrants from Guatemala (65.6%, a difference of 0.040%), Icelander (65.6%, a difference of 0.040%), and Guatemalan (65.6%, a difference of 0.040%).
| Demographics | Rating | Rank | In Labor Force | Age > 16 |
| Koreans | 95.3 /100 | #126 | Exceptional 65.7% |
| Immigrants | Eastern Asia | 94.9 /100 | #127 | Exceptional 65.7% |
| Ecuadorians | 94.7 /100 | #128 | Exceptional 65.6% |
| Immigrants | Philippines | 94.5 /100 | #129 | Exceptional 65.6% |
| Immigrants | Guatemala | 94.4 /100 | #130 | Exceptional 65.6% |
| Icelanders | 94.3 /100 | #131 | Exceptional 65.6% |
| Immigrants | North Macedonia | 94.1 /100 | #132 | Exceptional 65.6% |
| Immigrants | Lithuania | 93.5 /100 | #133 | Exceptional 65.6% |
| Costa Ricans | 93.2 /100 | #134 | Exceptional 65.6% |
| Guatemalans | 92.5 /100 | #135 | Exceptional 65.6% |
| Immigrants | Argentina | 92.4 /100 | #136 | Exceptional 65.6% |
| Guamanians/Chamorros | 92.4 /100 | #137 | Exceptional 65.6% |
| Immigrants | West Indies | 92.0 /100 | #138 | Exceptional 65.6% |
| Immigrants | Taiwan | 90.8 /100 | #139 | Exceptional 65.5% |
| Immigrants | Costa Rica | 90.8 /100 | #140 | Exceptional 65.5% |