Immigrants from Canada vs Immigrants from Fiji In Labor Force | Age > 16
COMPARE
Immigrants from Canada
Immigrants from Fiji
In Labor Force | Age > 16
In Labor Force | Age > 16 Comparison
Immigrants from Canada
Immigrants from Fiji
63.7%
IN LABOR FORCE | AGE > 16
0.0/ 100
METRIC RATING
295th/ 347
METRIC RANK
65.0%
IN LABOR FORCE | AGE > 16
33.7/ 100
METRIC RATING
192nd/ 347
METRIC RANK
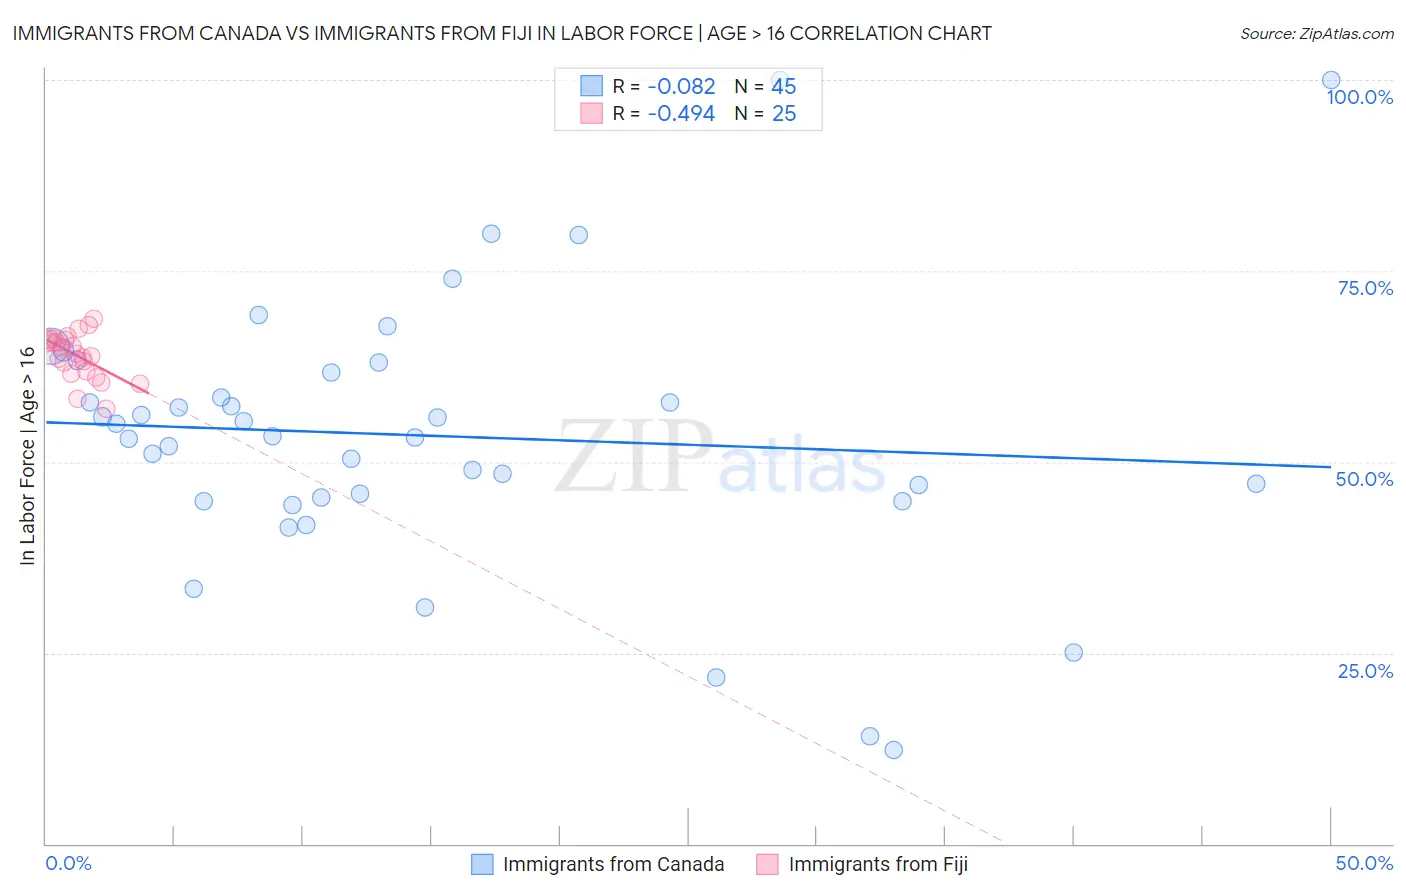
Immigrants from Canada vs Immigrants from Fiji In Labor Force | Age > 16 Correlation Chart
The statistical analysis conducted on geographies consisting of 459,409,569 people shows a slight negative correlation between the proportion of Immigrants from Canada and labor force participation rate among population ages 16 and over in the United States with a correlation coefficient (R) of -0.082 and weighted average of 63.7%. Similarly, the statistical analysis conducted on geographies consisting of 93,756,016 people shows a moderate negative correlation between the proportion of Immigrants from Fiji and labor force participation rate among population ages 16 and over in the United States with a correlation coefficient (R) of -0.494 and weighted average of 65.0%, a difference of 2.1%.
In Labor Force | Age > 16 Correlation Summary
| Measurement | Immigrants from Canada | Immigrants from Fiji |
| Minimum | 12.2% | 57.0% |
| Maximum | 100.0% | 68.8% |
| Range | 87.8% | 11.8% |
| Mean | 53.4% | 63.9% |
| Median | 53.3% | 64.2% |
| Interquartile 25% (IQ1) | 45.2% | 61.7% |
| Interquartile 75% (IQ3) | 62.4% | 66.0% |
| Interquartile Range (IQR) | 17.2% | 4.3% |
| Standard Deviation (Sample) | 17.8% | 3.0% |
| Standard Deviation (Population) | 17.6% | 2.9% |
Similar Demographics by In Labor Force | Age > 16
Demographics Similar to Immigrants from Canada by In Labor Force | Age > 16
In terms of in labor force | age > 16, the demographic groups most similar to Immigrants from Canada are Immigrants from North America (63.7%, a difference of 0.020%), Puget Sound Salish (63.7%, a difference of 0.050%), English (63.7%, a difference of 0.080%), Immigrants from Grenada (63.6%, a difference of 0.10%), and Comanche (63.6%, a difference of 0.11%).
| Demographics | Rating | Rank | In Labor Force | Age > 16 |
| Spanish | 0.1 /100 | #288 | Tragic 63.9% |
| Celtics | 0.1 /100 | #289 | Tragic 63.8% |
| Hungarians | 0.1 /100 | #290 | Tragic 63.8% |
| Nepalese | 0.1 /100 | #291 | Tragic 63.8% |
| Spanish American Indians | 0.1 /100 | #292 | Tragic 63.8% |
| English | 0.1 /100 | #293 | Tragic 63.7% |
| Puget Sound Salish | 0.0 /100 | #294 | Tragic 63.7% |
| Immigrants | Canada | 0.0 /100 | #295 | Tragic 63.7% |
| Immigrants | North America | 0.0 /100 | #296 | Tragic 63.7% |
| Immigrants | Grenada | 0.0 /100 | #297 | Tragic 63.6% |
| Comanche | 0.0 /100 | #298 | Tragic 63.6% |
| Whites/Caucasians | 0.0 /100 | #299 | Tragic 63.6% |
| Immigrants | Azores | 0.0 /100 | #300 | Tragic 63.6% |
| Spanish Americans | 0.0 /100 | #301 | Tragic 63.6% |
| Delaware | 0.0 /100 | #302 | Tragic 63.6% |
Demographics Similar to Immigrants from Fiji by In Labor Force | Age > 16
In terms of in labor force | age > 16, the demographic groups most similar to Immigrants from Fiji are Barbadian (65.0%, a difference of 0.0%), Scandinavian (65.0%, a difference of 0.0%), Immigrants from Europe (65.0%, a difference of 0.0%), Immigrants from Portugal (65.0%, a difference of 0.010%), and Immigrants from Greece (65.0%, a difference of 0.010%).
| Demographics | Rating | Rank | In Labor Force | Age > 16 |
| Syrians | 40.0 /100 | #185 | Average 65.0% |
| Immigrants | Switzerland | 38.2 /100 | #186 | Fair 65.0% |
| Immigrants | Croatia | 35.7 /100 | #187 | Fair 65.0% |
| Immigrants | Portugal | 34.8 /100 | #188 | Fair 65.0% |
| Immigrants | Greece | 34.3 /100 | #189 | Fair 65.0% |
| Barbadians | 33.9 /100 | #190 | Fair 65.0% |
| Scandinavians | 33.7 /100 | #191 | Fair 65.0% |
| Immigrants | Fiji | 33.7 /100 | #192 | Fair 65.0% |
| Immigrants | Europe | 33.6 /100 | #193 | Fair 65.0% |
| Immigrants | Southern Europe | 31.3 /100 | #194 | Fair 65.0% |
| Romanians | 31.1 /100 | #195 | Fair 65.0% |
| Haitians | 30.6 /100 | #196 | Fair 65.0% |
| Immigrants | Italy | 28.7 /100 | #197 | Fair 65.0% |
| Greeks | 26.1 /100 | #198 | Fair 64.9% |
| Mexican American Indians | 23.1 /100 | #199 | Fair 64.9% |