Immigrants from Canada vs Immigrants from Brazil In Labor Force | Age > 16
COMPARE
Immigrants from Canada
Immigrants from Brazil
In Labor Force | Age > 16
In Labor Force | Age > 16 Comparison
Immigrants from Canada
Immigrants from Brazil
63.7%
IN LABOR FORCE | AGE > 16
0.0/ 100
METRIC RATING
295th/ 347
METRIC RANK
66.7%
IN LABOR FORCE | AGE > 16
100.0/ 100
METRIC RATING
45th/ 347
METRIC RANK
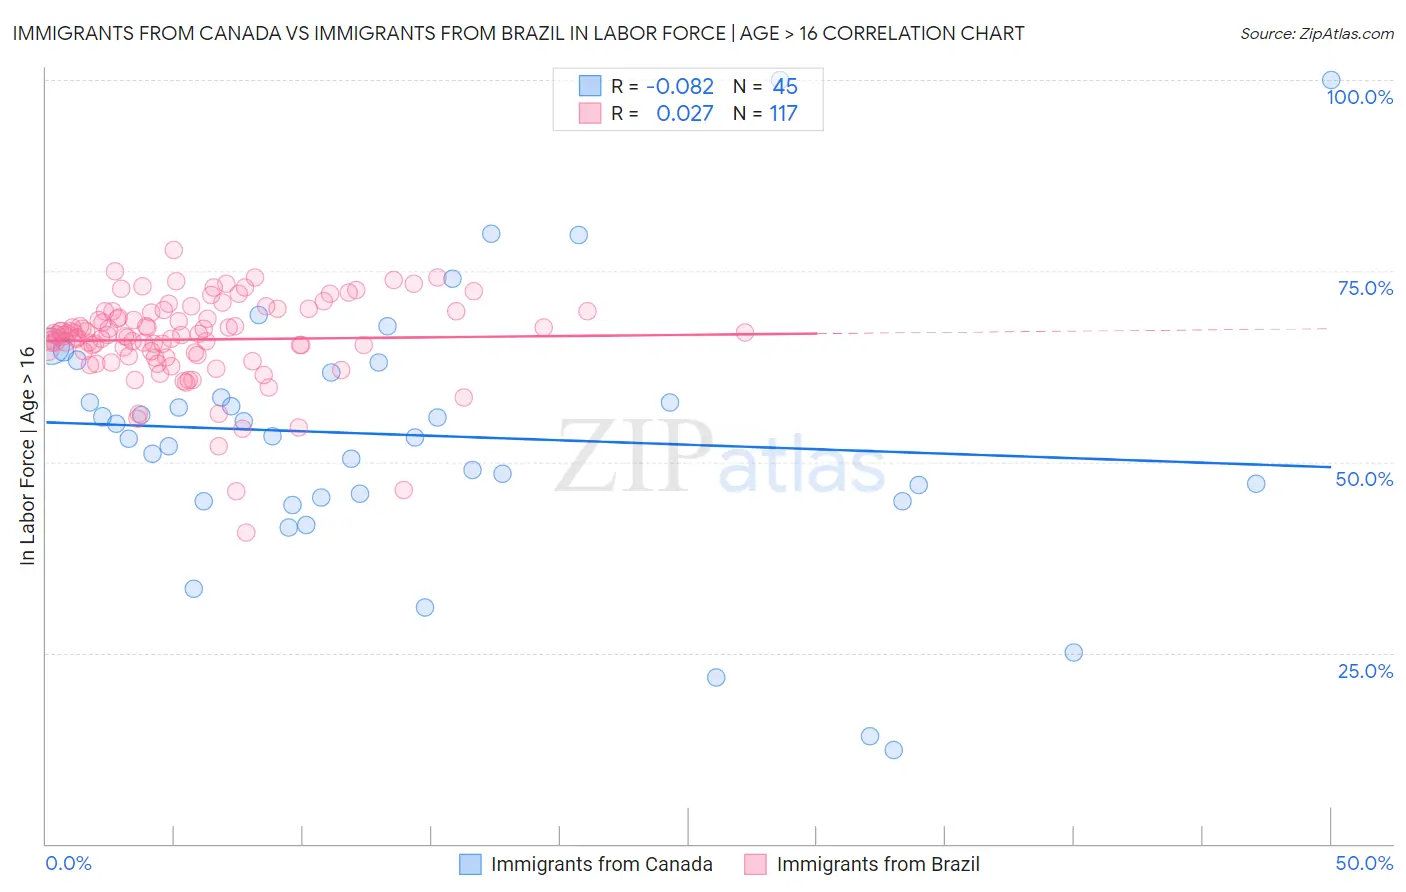
Immigrants from Canada vs Immigrants from Brazil In Labor Force | Age > 16 Correlation Chart
The statistical analysis conducted on geographies consisting of 459,409,569 people shows a slight negative correlation between the proportion of Immigrants from Canada and labor force participation rate among population ages 16 and over in the United States with a correlation coefficient (R) of -0.082 and weighted average of 63.7%. Similarly, the statistical analysis conducted on geographies consisting of 343,023,215 people shows no correlation between the proportion of Immigrants from Brazil and labor force participation rate among population ages 16 and over in the United States with a correlation coefficient (R) of 0.027 and weighted average of 66.7%, a difference of 4.7%.
In Labor Force | Age > 16 Correlation Summary
| Measurement | Immigrants from Canada | Immigrants from Brazil |
| Minimum | 12.2% | 40.7% |
| Maximum | 100.0% | 77.8% |
| Range | 87.8% | 37.1% |
| Mean | 53.4% | 66.0% |
| Median | 53.3% | 66.6% |
| Interquartile 25% (IQ1) | 45.2% | 63.9% |
| Interquartile 75% (IQ3) | 62.4% | 69.7% |
| Interquartile Range (IQR) | 17.2% | 5.8% |
| Standard Deviation (Sample) | 17.8% | 5.8% |
| Standard Deviation (Population) | 17.6% | 5.8% |
Similar Demographics by In Labor Force | Age > 16
Demographics Similar to Immigrants from Canada by In Labor Force | Age > 16
In terms of in labor force | age > 16, the demographic groups most similar to Immigrants from Canada are Immigrants from North America (63.7%, a difference of 0.020%), Puget Sound Salish (63.7%, a difference of 0.050%), English (63.7%, a difference of 0.080%), Immigrants from Grenada (63.6%, a difference of 0.10%), and Comanche (63.6%, a difference of 0.11%).
| Demographics | Rating | Rank | In Labor Force | Age > 16 |
| Spanish | 0.1 /100 | #288 | Tragic 63.9% |
| Celtics | 0.1 /100 | #289 | Tragic 63.8% |
| Hungarians | 0.1 /100 | #290 | Tragic 63.8% |
| Nepalese | 0.1 /100 | #291 | Tragic 63.8% |
| Spanish American Indians | 0.1 /100 | #292 | Tragic 63.8% |
| English | 0.1 /100 | #293 | Tragic 63.7% |
| Puget Sound Salish | 0.0 /100 | #294 | Tragic 63.7% |
| Immigrants | Canada | 0.0 /100 | #295 | Tragic 63.7% |
| Immigrants | North America | 0.0 /100 | #296 | Tragic 63.7% |
| Immigrants | Grenada | 0.0 /100 | #297 | Tragic 63.6% |
| Comanche | 0.0 /100 | #298 | Tragic 63.6% |
| Whites/Caucasians | 0.0 /100 | #299 | Tragic 63.6% |
| Immigrants | Azores | 0.0 /100 | #300 | Tragic 63.6% |
| Spanish Americans | 0.0 /100 | #301 | Tragic 63.6% |
| Delaware | 0.0 /100 | #302 | Tragic 63.6% |
Demographics Similar to Immigrants from Brazil by In Labor Force | Age > 16
In terms of in labor force | age > 16, the demographic groups most similar to Immigrants from Brazil are Immigrants from Pakistan (66.7%, a difference of 0.050%), Brazilian (66.6%, a difference of 0.070%), Immigrants from Bulgaria (66.6%, a difference of 0.070%), Nigerian (66.6%, a difference of 0.080%), and Luxembourger (66.7%, a difference of 0.10%).
| Demographics | Rating | Rank | In Labor Force | Age > 16 |
| Immigrants | Nigeria | 100.0 /100 | #38 | Exceptional 66.9% |
| Salvadorans | 100.0 /100 | #39 | Exceptional 66.8% |
| Immigrants | El Salvador | 100.0 /100 | #40 | Exceptional 66.8% |
| Immigrants | Zimbabwe | 100.0 /100 | #41 | Exceptional 66.8% |
| Senegalese | 100.0 /100 | #42 | Exceptional 66.7% |
| Luxembourgers | 100.0 /100 | #43 | Exceptional 66.7% |
| Immigrants | Pakistan | 100.0 /100 | #44 | Exceptional 66.7% |
| Immigrants | Brazil | 100.0 /100 | #45 | Exceptional 66.7% |
| Brazilians | 100.0 /100 | #46 | Exceptional 66.6% |
| Immigrants | Bulgaria | 100.0 /100 | #47 | Exceptional 66.6% |
| Nigerians | 100.0 /100 | #48 | Exceptional 66.6% |
| Immigrants | Northern Africa | 100.0 /100 | #49 | Exceptional 66.6% |
| Cape Verdeans | 100.0 /100 | #50 | Exceptional 66.6% |
| Immigrants | Kuwait | 100.0 /100 | #51 | Exceptional 66.5% |
| Paraguayans | 99.9 /100 | #52 | Exceptional 66.5% |