Immigrants from Canada vs Immigrants from Middle Africa In Labor Force | Age > 16
COMPARE
Immigrants from Canada
Immigrants from Middle Africa
In Labor Force | Age > 16
In Labor Force | Age > 16 Comparison
Immigrants from Canada
Immigrants from Middle Africa
63.7%
IN LABOR FORCE | AGE > 16
0.0/ 100
METRIC RATING
295th/ 347
METRIC RANK
67.7%
IN LABOR FORCE | AGE > 16
100.0/ 100
METRIC RATING
15th/ 347
METRIC RANK
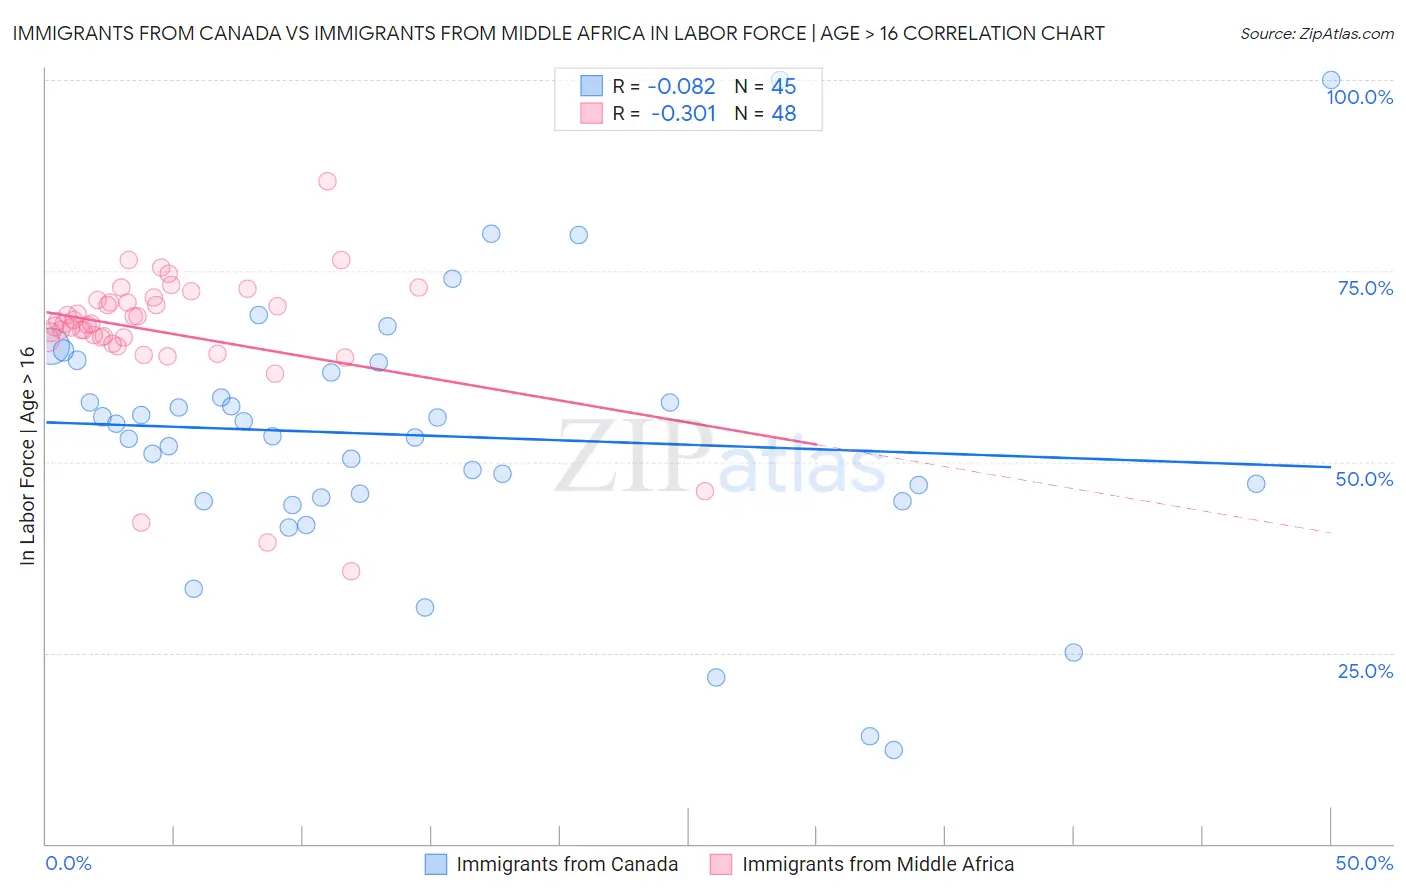
Immigrants from Canada vs Immigrants from Middle Africa In Labor Force | Age > 16 Correlation Chart
The statistical analysis conducted on geographies consisting of 459,409,569 people shows a slight negative correlation between the proportion of Immigrants from Canada and labor force participation rate among population ages 16 and over in the United States with a correlation coefficient (R) of -0.082 and weighted average of 63.7%. Similarly, the statistical analysis conducted on geographies consisting of 202,740,845 people shows a mild negative correlation between the proportion of Immigrants from Middle Africa and labor force participation rate among population ages 16 and over in the United States with a correlation coefficient (R) of -0.301 and weighted average of 67.7%, a difference of 6.4%.
In Labor Force | Age > 16 Correlation Summary
| Measurement | Immigrants from Canada | Immigrants from Middle Africa |
| Minimum | 12.2% | 35.7% |
| Maximum | 100.0% | 86.8% |
| Range | 87.8% | 51.1% |
| Mean | 53.4% | 67.0% |
| Median | 53.3% | 68.2% |
| Interquartile 25% (IQ1) | 45.2% | 66.1% |
| Interquartile 75% (IQ3) | 62.4% | 71.1% |
| Interquartile Range (IQR) | 17.2% | 5.0% |
| Standard Deviation (Sample) | 17.8% | 9.1% |
| Standard Deviation (Population) | 17.6% | 9.0% |
Similar Demographics by In Labor Force | Age > 16
Demographics Similar to Immigrants from Canada by In Labor Force | Age > 16
In terms of in labor force | age > 16, the demographic groups most similar to Immigrants from Canada are Immigrants from North America (63.7%, a difference of 0.020%), Puget Sound Salish (63.7%, a difference of 0.050%), English (63.7%, a difference of 0.080%), Immigrants from Grenada (63.6%, a difference of 0.10%), and Comanche (63.6%, a difference of 0.11%).
| Demographics | Rating | Rank | In Labor Force | Age > 16 |
| Spanish | 0.1 /100 | #288 | Tragic 63.9% |
| Celtics | 0.1 /100 | #289 | Tragic 63.8% |
| Hungarians | 0.1 /100 | #290 | Tragic 63.8% |
| Nepalese | 0.1 /100 | #291 | Tragic 63.8% |
| Spanish American Indians | 0.1 /100 | #292 | Tragic 63.8% |
| English | 0.1 /100 | #293 | Tragic 63.7% |
| Puget Sound Salish | 0.0 /100 | #294 | Tragic 63.7% |
| Immigrants | Canada | 0.0 /100 | #295 | Tragic 63.7% |
| Immigrants | North America | 0.0 /100 | #296 | Tragic 63.7% |
| Immigrants | Grenada | 0.0 /100 | #297 | Tragic 63.6% |
| Comanche | 0.0 /100 | #298 | Tragic 63.6% |
| Whites/Caucasians | 0.0 /100 | #299 | Tragic 63.6% |
| Immigrants | Azores | 0.0 /100 | #300 | Tragic 63.6% |
| Spanish Americans | 0.0 /100 | #301 | Tragic 63.6% |
| Delaware | 0.0 /100 | #302 | Tragic 63.6% |
Demographics Similar to Immigrants from Middle Africa by In Labor Force | Age > 16
In terms of in labor force | age > 16, the demographic groups most similar to Immigrants from Middle Africa are Liberian (67.8%, a difference of 0.050%), Immigrants from Sudan (67.7%, a difference of 0.11%), Immigrants from India (67.6%, a difference of 0.18%), Immigrants from Liberia (67.6%, a difference of 0.20%), and Kenyan (67.6%, a difference of 0.24%).
| Demographics | Rating | Rank | In Labor Force | Age > 16 |
| Immigrants | Sierra Leone | 100.0 /100 | #8 | Exceptional 68.5% |
| Immigrants | Eastern Africa | 100.0 /100 | #9 | Exceptional 68.5% |
| Immigrants | Bolivia | 100.0 /100 | #10 | Exceptional 68.4% |
| Bolivians | 100.0 /100 | #11 | Exceptional 68.2% |
| Sudanese | 100.0 /100 | #12 | Exceptional 68.0% |
| Immigrants | Nepal | 100.0 /100 | #13 | Exceptional 68.0% |
| Liberians | 100.0 /100 | #14 | Exceptional 67.8% |
| Immigrants | Middle Africa | 100.0 /100 | #15 | Exceptional 67.7% |
| Immigrants | Sudan | 100.0 /100 | #16 | Exceptional 67.7% |
| Immigrants | India | 100.0 /100 | #17 | Exceptional 67.6% |
| Immigrants | Liberia | 100.0 /100 | #18 | Exceptional 67.6% |
| Kenyans | 100.0 /100 | #19 | Exceptional 67.6% |
| Immigrants | Kenya | 100.0 /100 | #20 | Exceptional 67.6% |
| Tongans | 100.0 /100 | #21 | Exceptional 67.5% |
| Immigrants | Uganda | 100.0 /100 | #22 | Exceptional 67.5% |