Immigrants from Canada vs Immigrants from Fiji Divorced or Separated
COMPARE
Immigrants from Canada
Immigrants from Fiji
Divorced or Separated
Divorced or Separated Comparison
Immigrants from Canada
Immigrants from Fiji
12.1%
DIVORCED OR SEPARATED
44.0/ 100
METRIC RATING
181st/ 347
METRIC RANK
11.6%
DIVORCED OR SEPARATED
98.9/ 100
METRIC RATING
94th/ 347
METRIC RANK
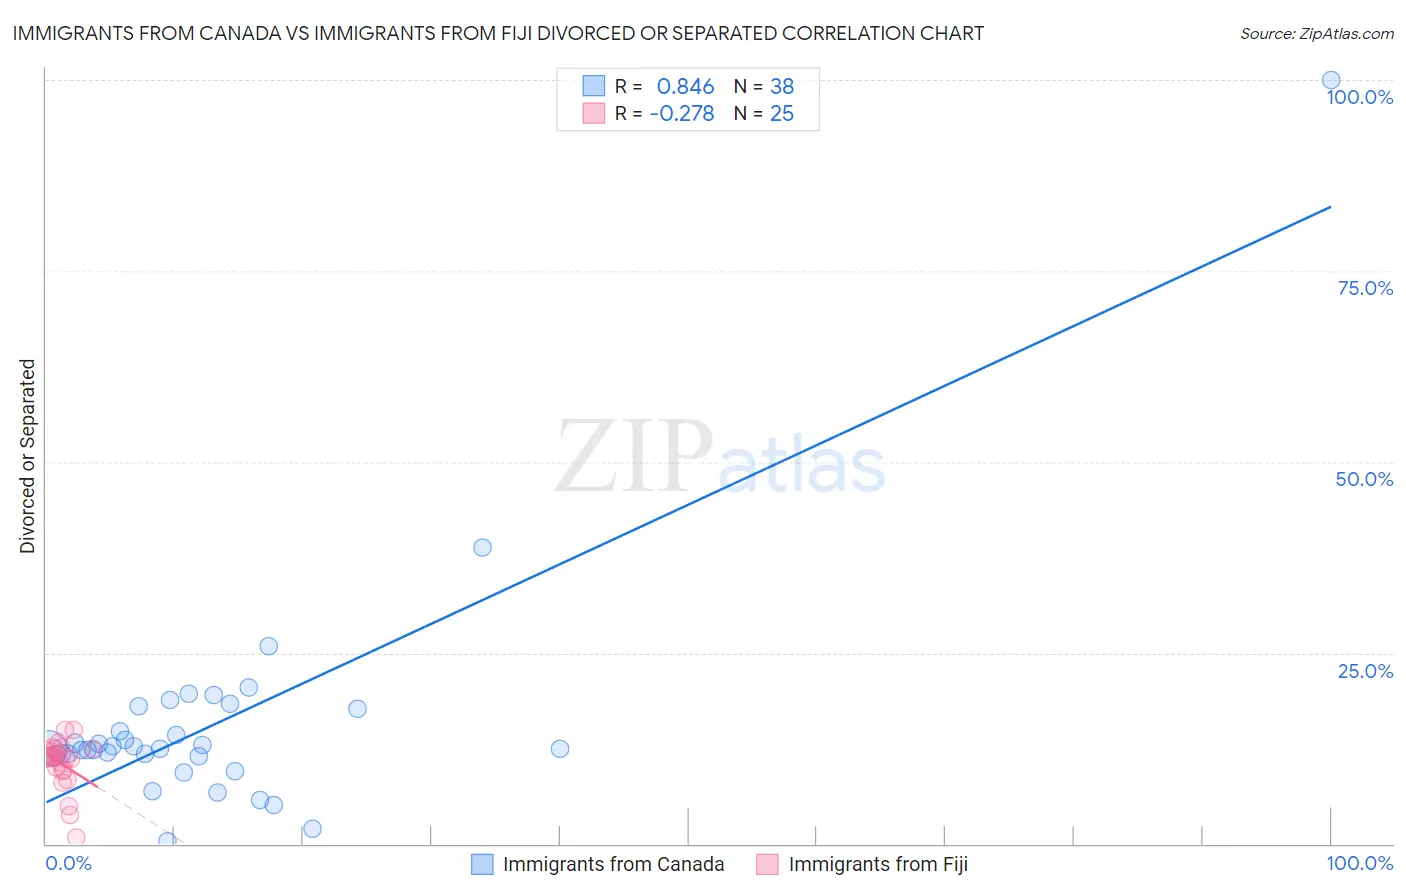
Immigrants from Canada vs Immigrants from Fiji Divorced or Separated Correlation Chart
The statistical analysis conducted on geographies consisting of 459,212,003 people shows a very strong positive correlation between the proportion of Immigrants from Canada and percentage of population currently divorced or separated in the United States with a correlation coefficient (R) of 0.846 and weighted average of 12.1%. Similarly, the statistical analysis conducted on geographies consisting of 93,755,407 people shows a weak negative correlation between the proportion of Immigrants from Fiji and percentage of population currently divorced or separated in the United States with a correlation coefficient (R) of -0.278 and weighted average of 11.6%, a difference of 4.3%.
Divorced or Separated Correlation Summary
| Measurement | Immigrants from Canada | Immigrants from Fiji |
| Minimum | 0.33% | 0.90% |
| Maximum | 100.0% | 14.9% |
| Range | 99.7% | 14.0% |
| Mean | 15.6% | 10.5% |
| Median | 12.5% | 11.3% |
| Interquartile 25% (IQ1) | 11.5% | 9.5% |
| Interquartile 75% (IQ3) | 17.6% | 12.4% |
| Interquartile Range (IQR) | 6.1% | 2.9% |
| Standard Deviation (Sample) | 15.5% | 3.2% |
| Standard Deviation (Population) | 15.3% | 3.2% |
Similar Demographics by Divorced or Separated
Demographics Similar to Immigrants from Canada by Divorced or Separated
In terms of divorced or separated, the demographic groups most similar to Immigrants from Canada are Barbadian (12.1%, a difference of 0.030%), Immigrants from Ethiopia (12.1%, a difference of 0.030%), Immigrants from Central America (12.1%, a difference of 0.040%), Immigrants from Western Europe (12.1%, a difference of 0.050%), and Ghanaian (12.1%, a difference of 0.060%).
| Demographics | Rating | Rank | Divorced or Separated |
| Hawaiians | 50.0 /100 | #174 | Average 12.1% |
| Immigrants | Sierra Leone | 50.0 /100 | #175 | Average 12.1% |
| Pennsylvania Germans | 48.9 /100 | #176 | Average 12.1% |
| Brazilians | 47.7 /100 | #177 | Average 12.1% |
| Ghanaians | 45.9 /100 | #178 | Average 12.1% |
| Immigrants | Western Europe | 45.6 /100 | #179 | Average 12.1% |
| Barbadians | 45.0 /100 | #180 | Average 12.1% |
| Immigrants | Canada | 44.0 /100 | #181 | Average 12.1% |
| Immigrants | Ethiopia | 43.1 /100 | #182 | Average 12.1% |
| Immigrants | Central America | 42.9 /100 | #183 | Average 12.1% |
| Immigrants | North America | 41.1 /100 | #184 | Average 12.1% |
| Immigrants | Nigeria | 40.5 /100 | #185 | Average 12.1% |
| Immigrants | Chile | 39.0 /100 | #186 | Fair 12.1% |
| Belizeans | 37.7 /100 | #187 | Fair 12.1% |
| Immigrants | Belize | 37.6 /100 | #188 | Fair 12.1% |
Demographics Similar to Immigrants from Fiji by Divorced or Separated
In terms of divorced or separated, the demographic groups most similar to Immigrants from Fiji are Immigrants from Denmark (11.6%, a difference of 0.010%), Arab (11.6%, a difference of 0.010%), Spanish American Indian (11.6%, a difference of 0.070%), Immigrants from Serbia (11.6%, a difference of 0.10%), and Zimbabwean (11.6%, a difference of 0.11%).
| Demographics | Rating | Rank | Divorced or Separated |
| Immigrants | Nepal | 99.2 /100 | #87 | Exceptional 11.6% |
| Immigrants | Europe | 99.2 /100 | #88 | Exceptional 11.6% |
| Immigrants | Southern Europe | 99.1 /100 | #89 | Exceptional 11.6% |
| Zimbabweans | 99.0 /100 | #90 | Exceptional 11.6% |
| Spanish American Indians | 99.0 /100 | #91 | Exceptional 11.6% |
| Immigrants | Denmark | 98.9 /100 | #92 | Exceptional 11.6% |
| Arabs | 98.9 /100 | #93 | Exceptional 11.6% |
| Immigrants | Fiji | 98.9 /100 | #94 | Exceptional 11.6% |
| Immigrants | Serbia | 98.8 /100 | #95 | Exceptional 11.6% |
| Immigrants | Ukraine | 98.7 /100 | #96 | Exceptional 11.6% |
| Latvians | 98.7 /100 | #97 | Exceptional 11.6% |
| Immigrants | Jordan | 98.6 /100 | #98 | Exceptional 11.6% |
| Immigrants | Sweden | 98.6 /100 | #99 | Exceptional 11.6% |
| Immigrants | Northern Europe | 98.6 /100 | #100 | Exceptional 11.6% |
| Immigrants | Guyana | 98.5 /100 | #101 | Exceptional 11.6% |