Central American vs Immigrants from Fiji In Labor Force | Age > 16
COMPARE
Central American
Immigrants from Fiji
In Labor Force | Age > 16
In Labor Force | Age > 16 Comparison
Central Americans
Immigrants from Fiji
66.1%
IN LABOR FORCE | AGE > 16
99.4/ 100
METRIC RATING
84th/ 347
METRIC RANK
65.0%
IN LABOR FORCE | AGE > 16
33.7/ 100
METRIC RATING
192nd/ 347
METRIC RANK
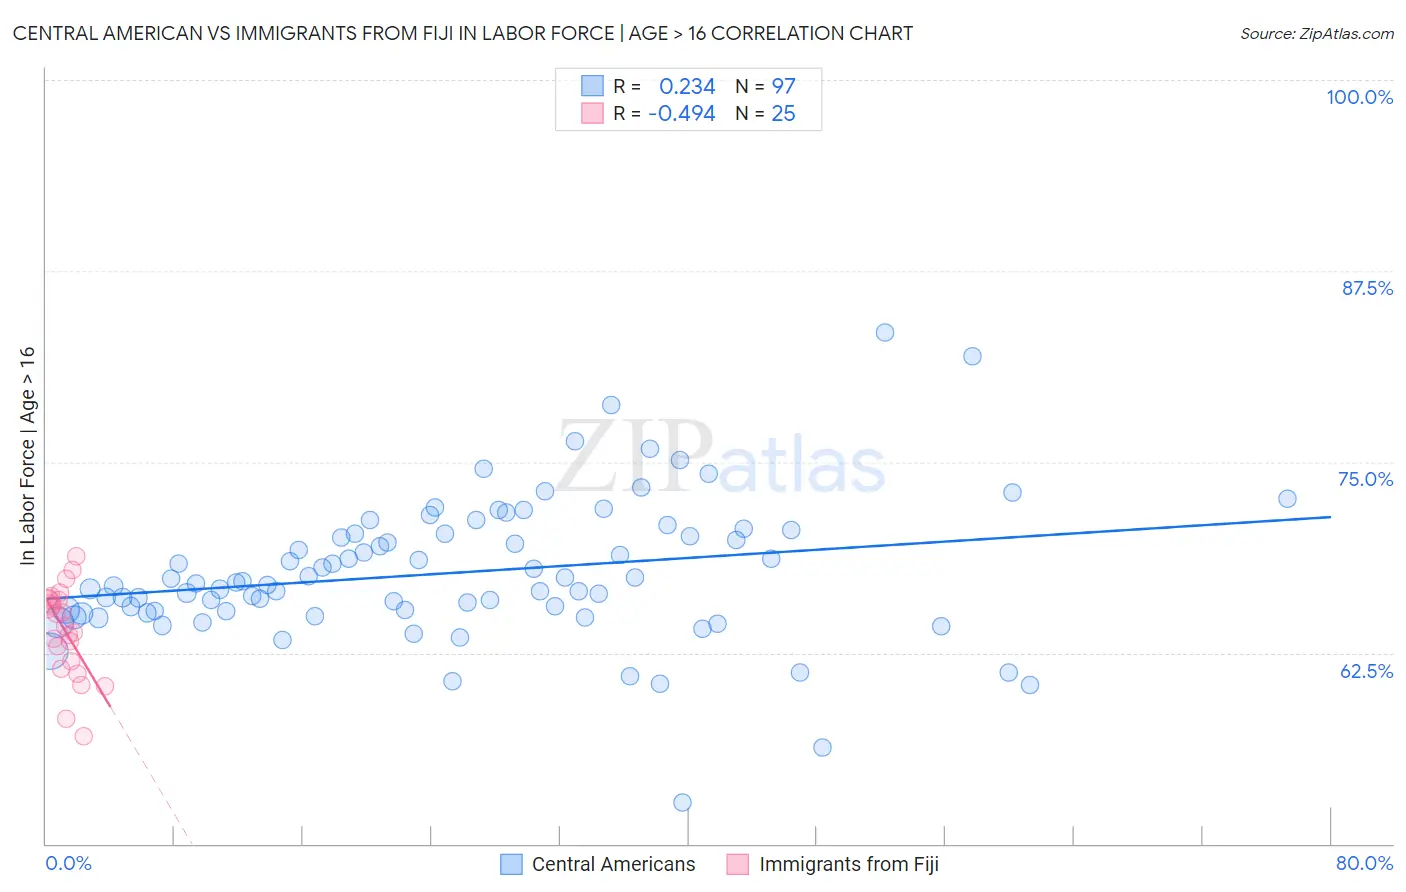
Central American vs Immigrants from Fiji In Labor Force | Age > 16 Correlation Chart
The statistical analysis conducted on geographies consisting of 504,613,567 people shows a weak positive correlation between the proportion of Central Americans and labor force participation rate among population ages 16 and over in the United States with a correlation coefficient (R) of 0.234 and weighted average of 66.1%. Similarly, the statistical analysis conducted on geographies consisting of 93,756,016 people shows a moderate negative correlation between the proportion of Immigrants from Fiji and labor force participation rate among population ages 16 and over in the United States with a correlation coefficient (R) of -0.494 and weighted average of 65.0%, a difference of 1.6%.
In Labor Force | Age > 16 Correlation Summary
| Measurement | Central American | Immigrants from Fiji |
| Minimum | 52.7% | 57.0% |
| Maximum | 83.5% | 68.8% |
| Range | 30.8% | 11.8% |
| Mean | 67.7% | 63.9% |
| Median | 67.0% | 64.2% |
| Interquartile 25% (IQ1) | 65.2% | 61.7% |
| Interquartile 75% (IQ3) | 70.3% | 66.0% |
| Interquartile Range (IQR) | 5.1% | 4.3% |
| Standard Deviation (Sample) | 4.7% | 3.0% |
| Standard Deviation (Population) | 4.6% | 2.9% |
Similar Demographics by In Labor Force | Age > 16
Demographics Similar to Central Americans by In Labor Force | Age > 16
In terms of in labor force | age > 16, the demographic groups most similar to Central Americans are Immigrants from Jordan (66.1%, a difference of 0.0%), German Russian (66.1%, a difference of 0.010%), Moroccan (66.1%, a difference of 0.020%), Mongolian (66.1%, a difference of 0.020%), and South American (66.0%, a difference of 0.030%).
| Demographics | Rating | Rank | In Labor Force | Age > 16 |
| Immigrants | Moldova | 99.6 /100 | #77 | Exceptional 66.1% |
| Immigrants | Asia | 99.6 /100 | #78 | Exceptional 66.1% |
| Turks | 99.6 /100 | #79 | Exceptional 66.1% |
| Malaysians | 99.6 /100 | #80 | Exceptional 66.1% |
| Moroccans | 99.5 /100 | #81 | Exceptional 66.1% |
| German Russians | 99.4 /100 | #82 | Exceptional 66.1% |
| Immigrants | Jordan | 99.4 /100 | #83 | Exceptional 66.1% |
| Central Americans | 99.4 /100 | #84 | Exceptional 66.1% |
| Mongolians | 99.4 /100 | #85 | Exceptional 66.1% |
| South Americans | 99.4 /100 | #86 | Exceptional 66.0% |
| South American Indians | 99.4 /100 | #87 | Exceptional 66.0% |
| Bermudans | 99.3 /100 | #88 | Exceptional 66.0% |
| Immigrants | Laos | 99.2 /100 | #89 | Exceptional 66.0% |
| Chileans | 99.2 /100 | #90 | Exceptional 66.0% |
| Iranians | 99.2 /100 | #91 | Exceptional 66.0% |
Demographics Similar to Immigrants from Fiji by In Labor Force | Age > 16
In terms of in labor force | age > 16, the demographic groups most similar to Immigrants from Fiji are Barbadian (65.0%, a difference of 0.0%), Scandinavian (65.0%, a difference of 0.0%), Immigrants from Europe (65.0%, a difference of 0.0%), Immigrants from Portugal (65.0%, a difference of 0.010%), and Immigrants from Greece (65.0%, a difference of 0.010%).
| Demographics | Rating | Rank | In Labor Force | Age > 16 |
| Syrians | 40.0 /100 | #185 | Average 65.0% |
| Immigrants | Switzerland | 38.2 /100 | #186 | Fair 65.0% |
| Immigrants | Croatia | 35.7 /100 | #187 | Fair 65.0% |
| Immigrants | Portugal | 34.8 /100 | #188 | Fair 65.0% |
| Immigrants | Greece | 34.3 /100 | #189 | Fair 65.0% |
| Barbadians | 33.9 /100 | #190 | Fair 65.0% |
| Scandinavians | 33.7 /100 | #191 | Fair 65.0% |
| Immigrants | Fiji | 33.7 /100 | #192 | Fair 65.0% |
| Immigrants | Europe | 33.6 /100 | #193 | Fair 65.0% |
| Immigrants | Southern Europe | 31.3 /100 | #194 | Fair 65.0% |
| Romanians | 31.1 /100 | #195 | Fair 65.0% |
| Haitians | 30.6 /100 | #196 | Fair 65.0% |
| Immigrants | Italy | 28.7 /100 | #197 | Fair 65.0% |
| Greeks | 26.1 /100 | #198 | Fair 64.9% |
| Mexican American Indians | 23.1 /100 | #199 | Fair 64.9% |