Immigrants from Canada vs Uruguayan In Labor Force | Age > 16
COMPARE
Immigrants from Canada
Uruguayan
In Labor Force | Age > 16
In Labor Force | Age > 16 Comparison
Immigrants from Canada
Uruguayans
63.7%
IN LABOR FORCE | AGE > 16
0.0/ 100
METRIC RATING
295th/ 347
METRIC RANK
65.9%
IN LABOR FORCE | AGE > 16
98.6/ 100
METRIC RATING
102nd/ 347
METRIC RANK
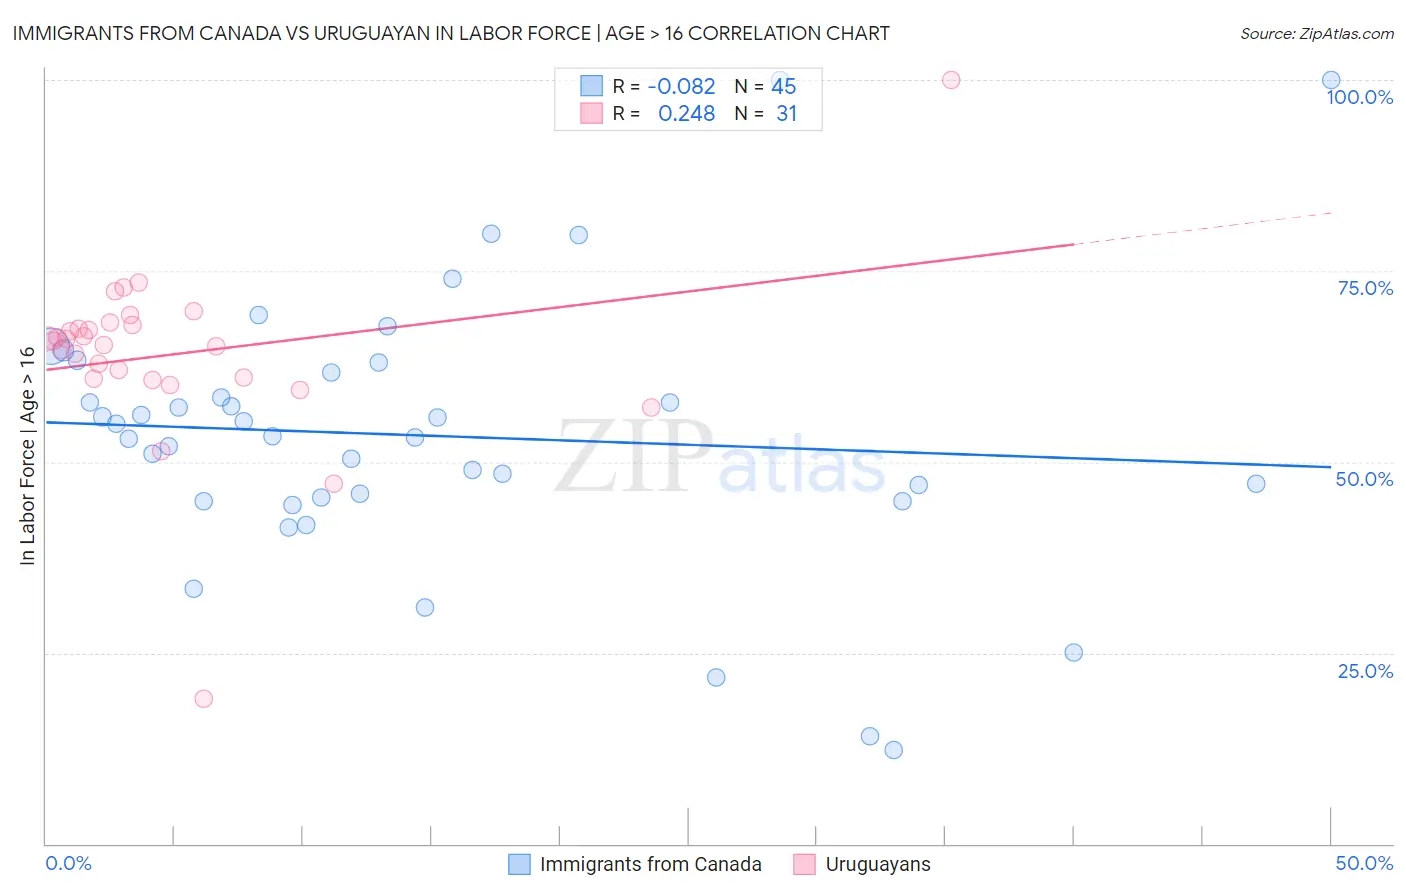
Immigrants from Canada vs Uruguayan In Labor Force | Age > 16 Correlation Chart
The statistical analysis conducted on geographies consisting of 459,409,569 people shows a slight negative correlation between the proportion of Immigrants from Canada and labor force participation rate among population ages 16 and over in the United States with a correlation coefficient (R) of -0.082 and weighted average of 63.7%. Similarly, the statistical analysis conducted on geographies consisting of 144,784,894 people shows a weak positive correlation between the proportion of Uruguayans and labor force participation rate among population ages 16 and over in the United States with a correlation coefficient (R) of 0.248 and weighted average of 65.9%, a difference of 3.5%.
In Labor Force | Age > 16 Correlation Summary
| Measurement | Immigrants from Canada | Uruguayan |
| Minimum | 12.2% | 19.0% |
| Maximum | 100.0% | 100.0% |
| Range | 87.8% | 81.0% |
| Mean | 53.4% | 64.1% |
| Median | 53.3% | 65.8% |
| Interquartile 25% (IQ1) | 45.2% | 60.9% |
| Interquartile 75% (IQ3) | 62.4% | 68.0% |
| Interquartile Range (IQR) | 17.2% | 7.1% |
| Standard Deviation (Sample) | 17.8% | 11.9% |
| Standard Deviation (Population) | 17.6% | 11.7% |
Similar Demographics by In Labor Force | Age > 16
Demographics Similar to Immigrants from Canada by In Labor Force | Age > 16
In terms of in labor force | age > 16, the demographic groups most similar to Immigrants from Canada are Immigrants from North America (63.7%, a difference of 0.020%), Puget Sound Salish (63.7%, a difference of 0.050%), English (63.7%, a difference of 0.080%), Immigrants from Grenada (63.6%, a difference of 0.10%), and Comanche (63.6%, a difference of 0.11%).
| Demographics | Rating | Rank | In Labor Force | Age > 16 |
| Spanish | 0.1 /100 | #288 | Tragic 63.9% |
| Celtics | 0.1 /100 | #289 | Tragic 63.8% |
| Hungarians | 0.1 /100 | #290 | Tragic 63.8% |
| Nepalese | 0.1 /100 | #291 | Tragic 63.8% |
| Spanish American Indians | 0.1 /100 | #292 | Tragic 63.8% |
| English | 0.1 /100 | #293 | Tragic 63.7% |
| Puget Sound Salish | 0.0 /100 | #294 | Tragic 63.7% |
| Immigrants | Canada | 0.0 /100 | #295 | Tragic 63.7% |
| Immigrants | North America | 0.0 /100 | #296 | Tragic 63.7% |
| Immigrants | Grenada | 0.0 /100 | #297 | Tragic 63.6% |
| Comanche | 0.0 /100 | #298 | Tragic 63.6% |
| Whites/Caucasians | 0.0 /100 | #299 | Tragic 63.6% |
| Immigrants | Azores | 0.0 /100 | #300 | Tragic 63.6% |
| Spanish Americans | 0.0 /100 | #301 | Tragic 63.6% |
| Delaware | 0.0 /100 | #302 | Tragic 63.6% |
Demographics Similar to Uruguayans by In Labor Force | Age > 16
In terms of in labor force | age > 16, the demographic groups most similar to Uruguayans are Immigrants from Colombia (65.9%, a difference of 0.0%), Immigrants from Australia (65.9%, a difference of 0.010%), Okinawan (65.9%, a difference of 0.010%), Immigrants from Chile (65.9%, a difference of 0.020%), and Immigrants from South Eastern Asia (65.9%, a difference of 0.020%).
| Demographics | Rating | Rank | In Labor Force | Age > 16 |
| Immigrants | Uruguay | 99.1 /100 | #95 | Exceptional 66.0% |
| Bangladeshis | 98.9 /100 | #96 | Exceptional 65.9% |
| Filipinos | 98.9 /100 | #97 | Exceptional 65.9% |
| Immigrants | Chile | 98.7 /100 | #98 | Exceptional 65.9% |
| Immigrants | Australia | 98.7 /100 | #99 | Exceptional 65.9% |
| Okinawans | 98.7 /100 | #100 | Exceptional 65.9% |
| Immigrants | Colombia | 98.6 /100 | #101 | Exceptional 65.9% |
| Uruguayans | 98.6 /100 | #102 | Exceptional 65.9% |
| Immigrants | South Eastern Asia | 98.5 /100 | #103 | Exceptional 65.9% |
| Palestinians | 98.5 /100 | #104 | Exceptional 65.9% |
| Colombians | 98.4 /100 | #105 | Exceptional 65.9% |
| Immigrants | Serbia | 98.1 /100 | #106 | Exceptional 65.8% |
| Immigrants | Poland | 98.1 /100 | #107 | Exceptional 65.8% |
| Immigrants | Spain | 98.0 /100 | #108 | Exceptional 65.8% |
| Immigrants | Japan | 98.0 /100 | #109 | Exceptional 65.8% |