Immigrants from Somalia vs Marshallese In Labor Force | Age 35-44
COMPARE
Immigrants from Somalia
Marshallese
In Labor Force | Age 35-44
In Labor Force | Age 35-44 Comparison
Immigrants from Somalia
Marshallese
85.6%
IN LABOR FORCE | AGE 35-44
100.0/ 100
METRIC RATING
14th/ 347
METRIC RANK
82.4%
IN LABOR FORCE | AGE 35-44
0.0/ 100
METRIC RATING
304th/ 347
METRIC RANK
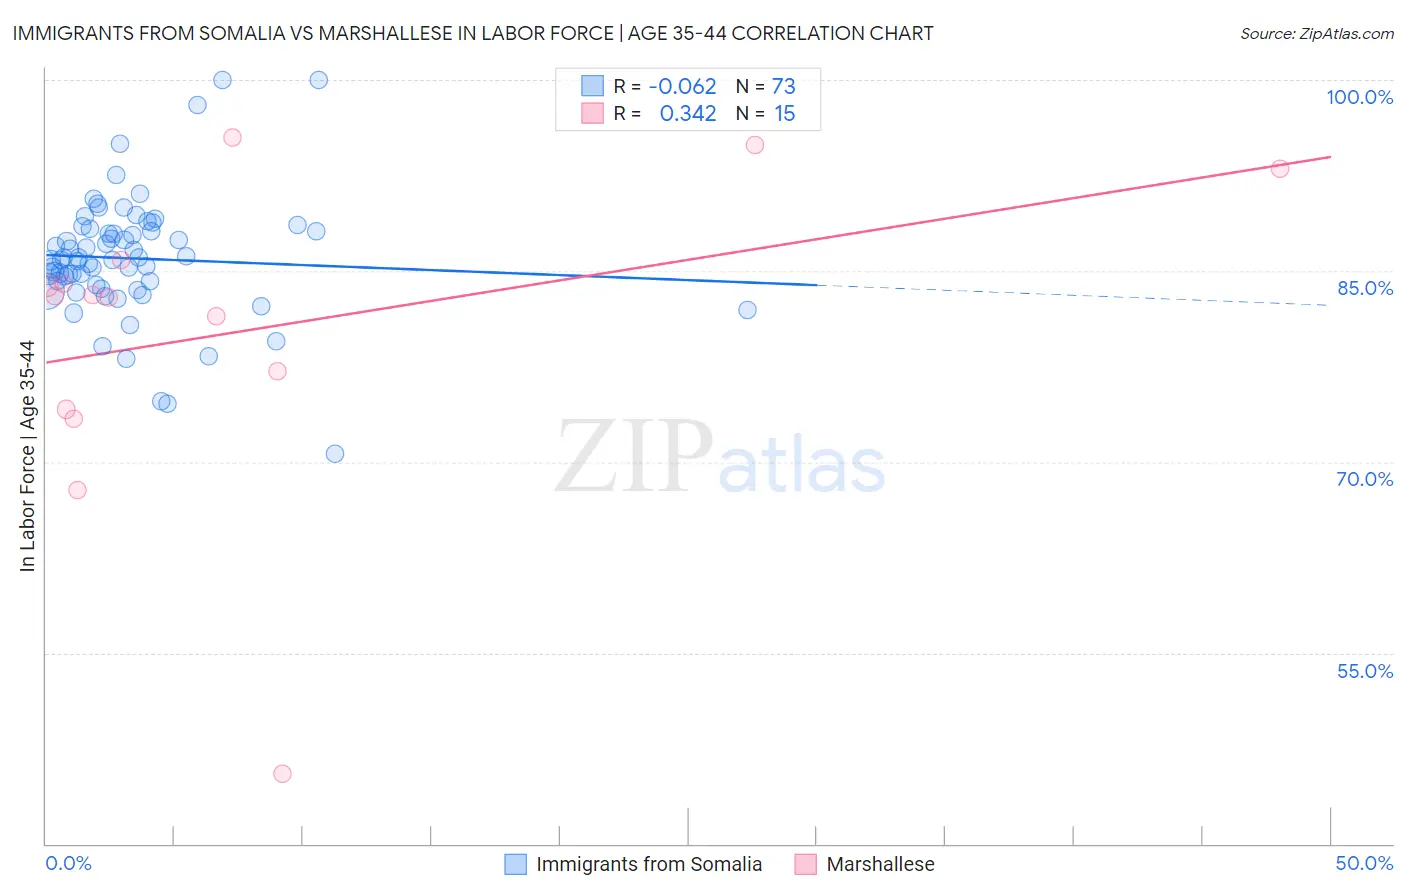
Immigrants from Somalia vs Marshallese In Labor Force | Age 35-44 Correlation Chart
The statistical analysis conducted on geographies consisting of 92,101,843 people shows a slight negative correlation between the proportion of Immigrants from Somalia and labor force participation rate among population between the ages 35 and 44 in the United States with a correlation coefficient (R) of -0.062 and weighted average of 85.6%. Similarly, the statistical analysis conducted on geographies consisting of 14,760,991 people shows a mild positive correlation between the proportion of Marshallese and labor force participation rate among population between the ages 35 and 44 in the United States with a correlation coefficient (R) of 0.342 and weighted average of 82.4%, a difference of 3.9%.
In Labor Force | Age 35-44 Correlation Summary
| Measurement | Immigrants from Somalia | Marshallese |
| Minimum | 70.6% | 45.5% |
| Maximum | 100.0% | 95.5% |
| Range | 29.4% | 50.0% |
| Mean | 86.0% | 80.4% |
| Median | 85.9% | 83.0% |
| Interquartile 25% (IQ1) | 83.8% | 74.1% |
| Interquartile 75% (IQ3) | 88.2% | 85.9% |
| Interquartile Range (IQR) | 4.4% | 11.8% |
| Standard Deviation (Sample) | 4.9% | 12.4% |
| Standard Deviation (Population) | 4.8% | 12.0% |
Similar Demographics by In Labor Force | Age 35-44
Demographics Similar to Immigrants from Somalia by In Labor Force | Age 35-44
In terms of in labor force | age 35-44, the demographic groups most similar to Immigrants from Somalia are Somali (85.6%, a difference of 0.0%), Liberian (85.7%, a difference of 0.020%), Norwegian (85.6%, a difference of 0.040%), Immigrants from Ireland (85.6%, a difference of 0.040%), and Immigrants from North Macedonia (85.6%, a difference of 0.090%).
| Demographics | Rating | Rank | In Labor Force | Age 35-44 |
| Immigrants | Sierra Leone | 100.0 /100 | #7 | Exceptional 86.1% |
| Immigrants | Ethiopia | 100.0 /100 | #8 | Exceptional 85.9% |
| Ethiopians | 100.0 /100 | #9 | Exceptional 85.9% |
| Cape Verdeans | 100.0 /100 | #10 | Exceptional 85.8% |
| Immigrants | Cameroon | 100.0 /100 | #11 | Exceptional 85.8% |
| Liberians | 100.0 /100 | #12 | Exceptional 85.7% |
| Somalis | 100.0 /100 | #13 | Exceptional 85.6% |
| Immigrants | Somalia | 100.0 /100 | #14 | Exceptional 85.6% |
| Norwegians | 100.0 /100 | #15 | Exceptional 85.6% |
| Immigrants | Ireland | 100.0 /100 | #16 | Exceptional 85.6% |
| Immigrants | North Macedonia | 100.0 /100 | #17 | Exceptional 85.6% |
| Carpatho Rusyns | 100.0 /100 | #18 | Exceptional 85.6% |
| Slovenes | 100.0 /100 | #19 | Exceptional 85.6% |
| Immigrants | Serbia | 100.0 /100 | #20 | Exceptional 85.5% |
| Bulgarians | 100.0 /100 | #21 | Exceptional 85.5% |
Demographics Similar to Marshallese by In Labor Force | Age 35-44
In terms of in labor force | age 35-44, the demographic groups most similar to Marshallese are American (82.4%, a difference of 0.010%), Nepalese (82.4%, a difference of 0.010%), Spanish American Indian (82.5%, a difference of 0.080%), Central American Indian (82.5%, a difference of 0.11%), and Tlingit-Haida (82.5%, a difference of 0.17%).
| Demographics | Rating | Rank | In Labor Force | Age 35-44 |
| Hmong | 0.0 /100 | #297 | Tragic 82.6% |
| Ottawa | 0.0 /100 | #298 | Tragic 82.6% |
| Tlingit-Haida | 0.0 /100 | #299 | Tragic 82.5% |
| Central American Indians | 0.0 /100 | #300 | Tragic 82.5% |
| Spanish American Indians | 0.0 /100 | #301 | Tragic 82.5% |
| Americans | 0.0 /100 | #302 | Tragic 82.4% |
| Nepalese | 0.0 /100 | #303 | Tragic 82.4% |
| Marshallese | 0.0 /100 | #304 | Tragic 82.4% |
| Shoshone | 0.0 /100 | #305 | Tragic 82.2% |
| Blacks/African Americans | 0.0 /100 | #306 | Tragic 82.2% |
| Hispanics or Latinos | 0.0 /100 | #307 | Tragic 82.1% |
| Immigrants | Central America | 0.0 /100 | #308 | Tragic 82.0% |
| Cree | 0.0 /100 | #309 | Tragic 82.0% |
| Blackfeet | 0.0 /100 | #310 | Tragic 81.9% |
| Colville | 0.0 /100 | #311 | Tragic 81.7% |