Immigrants from Albania vs Immigrants from Panama In Labor Force | Age 35-44
COMPARE
Immigrants from Albania
Immigrants from Panama
In Labor Force | Age 35-44
In Labor Force | Age 35-44 Comparison
Immigrants from Albania
Immigrants from Panama
85.1%
IN LABOR FORCE | AGE 35-44
99.7/ 100
METRIC RATING
51st/ 347
METRIC RANK
84.0%
IN LABOR FORCE | AGE 35-44
6.4/ 100
METRIC RATING
223rd/ 347
METRIC RANK
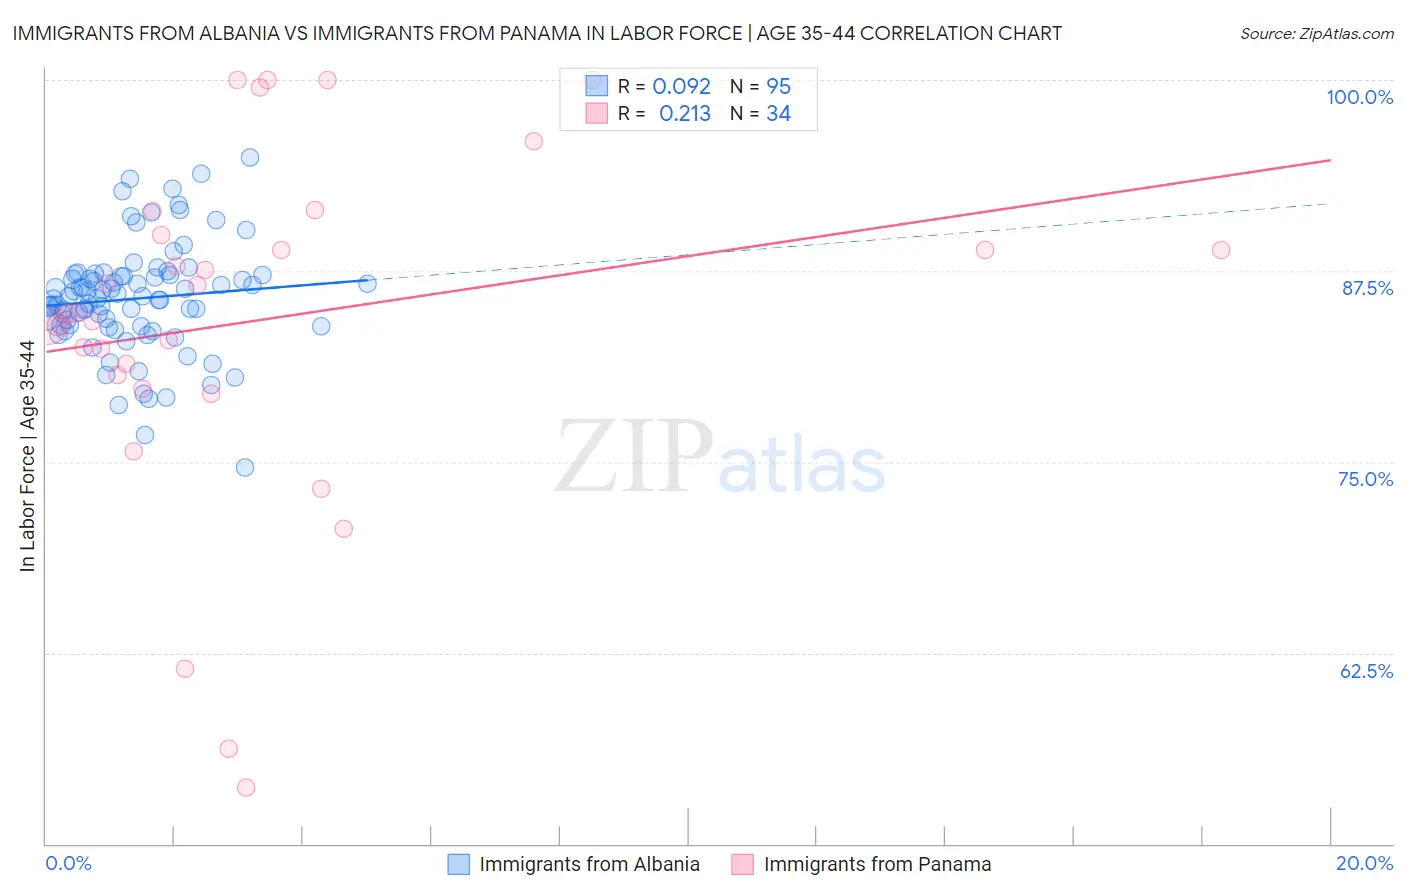
Immigrants from Albania vs Immigrants from Panama In Labor Force | Age 35-44 Correlation Chart
The statistical analysis conducted on geographies consisting of 119,387,353 people shows a slight positive correlation between the proportion of Immigrants from Albania and labor force participation rate among population between the ages 35 and 44 in the United States with a correlation coefficient (R) of 0.092 and weighted average of 85.1%. Similarly, the statistical analysis conducted on geographies consisting of 221,162,484 people shows a weak positive correlation between the proportion of Immigrants from Panama and labor force participation rate among population between the ages 35 and 44 in the United States with a correlation coefficient (R) of 0.213 and weighted average of 84.0%, a difference of 1.4%.
In Labor Force | Age 35-44 Correlation Summary
| Measurement | Immigrants from Albania | Immigrants from Panama |
| Minimum | 74.6% | 53.7% |
| Maximum | 94.9% | 100.0% |
| Range | 20.3% | 46.3% |
| Mean | 85.7% | 84.3% |
| Median | 85.7% | 84.7% |
| Interquartile 25% (IQ1) | 83.9% | 80.7% |
| Interquartile 75% (IQ3) | 87.2% | 89.8% |
| Interquartile Range (IQR) | 3.3% | 9.2% |
| Standard Deviation (Sample) | 3.6% | 11.4% |
| Standard Deviation (Population) | 3.6% | 11.2% |
Similar Demographics by In Labor Force | Age 35-44
Demographics Similar to Immigrants from Albania by In Labor Force | Age 35-44
In terms of in labor force | age 35-44, the demographic groups most similar to Immigrants from Albania are Thai (85.2%, a difference of 0.0%), Croatian (85.2%, a difference of 0.030%), Immigrants from Kenya (85.1%, a difference of 0.030%), Immigrants from Eritrea (85.2%, a difference of 0.040%), and Taiwanese (85.1%, a difference of 0.040%).
| Demographics | Rating | Rank | In Labor Force | Age 35-44 |
| Lithuanians | 99.8 /100 | #44 | Exceptional 85.2% |
| Cypriots | 99.8 /100 | #45 | Exceptional 85.2% |
| Immigrants | Hong Kong | 99.8 /100 | #46 | Exceptional 85.2% |
| German Russians | 99.8 /100 | #47 | Exceptional 85.2% |
| Immigrants | Eritrea | 99.7 /100 | #48 | Exceptional 85.2% |
| Croatians | 99.7 /100 | #49 | Exceptional 85.2% |
| Thais | 99.7 /100 | #50 | Exceptional 85.2% |
| Immigrants | Albania | 99.7 /100 | #51 | Exceptional 85.1% |
| Immigrants | Kenya | 99.6 /100 | #52 | Exceptional 85.1% |
| Taiwanese | 99.6 /100 | #53 | Exceptional 85.1% |
| Turks | 99.5 /100 | #54 | Exceptional 85.1% |
| Soviet Union | 99.5 /100 | #55 | Exceptional 85.1% |
| Immigrants | Croatia | 99.5 /100 | #56 | Exceptional 85.1% |
| Chinese | 99.4 /100 | #57 | Exceptional 85.1% |
| Slovaks | 99.4 /100 | #58 | Exceptional 85.1% |
Demographics Similar to Immigrants from Panama by In Labor Force | Age 35-44
In terms of in labor force | age 35-44, the demographic groups most similar to Immigrants from Panama are Assyrian/Chaldean/Syriac (84.0%, a difference of 0.0%), Icelander (84.0%, a difference of 0.010%), U.S. Virgin Islander (84.0%, a difference of 0.010%), Immigrants from Burma/Myanmar (84.0%, a difference of 0.010%), and French (84.0%, a difference of 0.030%).
| Demographics | Rating | Rank | In Labor Force | Age 35-44 |
| Nicaraguans | 12.1 /100 | #216 | Poor 84.1% |
| Immigrants | Norway | 11.7 /100 | #217 | Poor 84.1% |
| Immigrants | Nicaragua | 9.4 /100 | #218 | Tragic 84.1% |
| Sub-Saharan Africans | 9.3 /100 | #219 | Tragic 84.1% |
| French | 7.5 /100 | #220 | Tragic 84.0% |
| Icelanders | 6.7 /100 | #221 | Tragic 84.0% |
| Assyrians/Chaldeans/Syriacs | 6.6 /100 | #222 | Tragic 84.0% |
| Immigrants | Panama | 6.4 /100 | #223 | Tragic 84.0% |
| U.S. Virgin Islanders | 6.1 /100 | #224 | Tragic 84.0% |
| Immigrants | Burma/Myanmar | 6.1 /100 | #225 | Tragic 84.0% |
| Panamanians | 5.4 /100 | #226 | Tragic 84.0% |
| British West Indians | 5.3 /100 | #227 | Tragic 84.0% |
| Welsh | 5.3 /100 | #228 | Tragic 84.0% |
| Immigrants | Thailand | 4.7 /100 | #229 | Tragic 84.0% |
| Immigrants | Iraq | 3.7 /100 | #230 | Tragic 83.9% |