Pueblo vs Marshallese In Labor Force | Age 35-44
COMPARE
Pueblo
Marshallese
In Labor Force | Age 35-44
In Labor Force | Age 35-44 Comparison
Pueblo
Marshallese
77.4%
IN LABOR FORCE | AGE 35-44
0.0/ 100
METRIC RATING
338th/ 347
METRIC RANK
82.4%
IN LABOR FORCE | AGE 35-44
0.0/ 100
METRIC RATING
304th/ 347
METRIC RANK
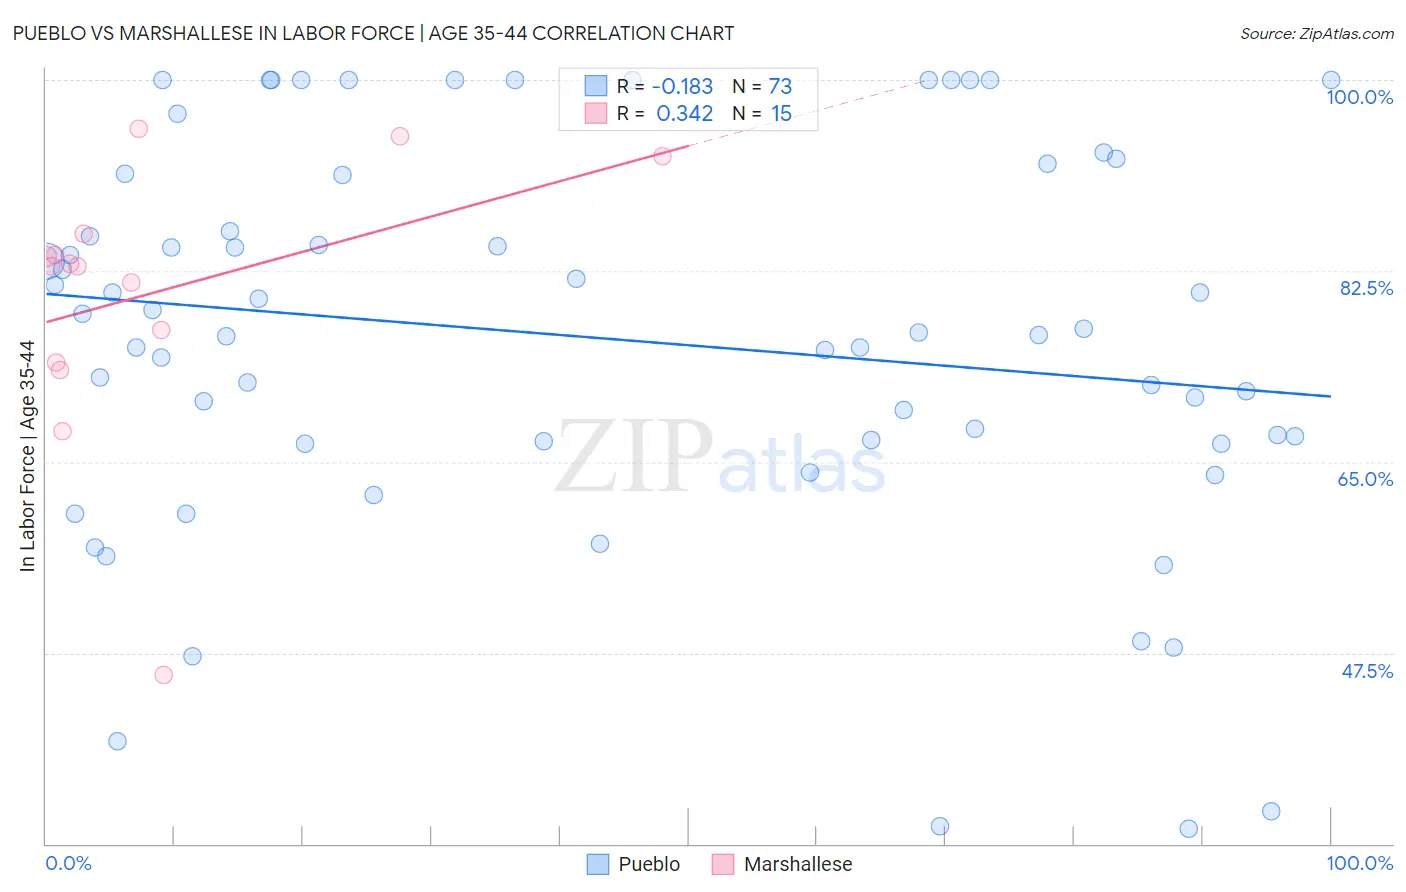
Pueblo vs Marshallese In Labor Force | Age 35-44 Correlation Chart
The statistical analysis conducted on geographies consisting of 120,075,007 people shows a poor negative correlation between the proportion of Pueblo and labor force participation rate among population between the ages 35 and 44 in the United States with a correlation coefficient (R) of -0.183 and weighted average of 77.4%. Similarly, the statistical analysis conducted on geographies consisting of 14,760,991 people shows a mild positive correlation between the proportion of Marshallese and labor force participation rate among population between the ages 35 and 44 in the United States with a correlation coefficient (R) of 0.342 and weighted average of 82.4%, a difference of 6.5%.
In Labor Force | Age 35-44 Correlation Summary
| Measurement | Pueblo | Marshallese |
| Minimum | 31.4% | 45.5% |
| Maximum | 100.0% | 95.5% |
| Range | 68.6% | 50.0% |
| Mean | 76.4% | 80.4% |
| Median | 76.9% | 83.0% |
| Interquartile 25% (IQ1) | 66.8% | 74.1% |
| Interquartile 75% (IQ3) | 91.3% | 85.9% |
| Interquartile Range (IQR) | 24.6% | 11.8% |
| Standard Deviation (Sample) | 17.8% | 12.4% |
| Standard Deviation (Population) | 17.7% | 12.0% |
Similar Demographics by In Labor Force | Age 35-44
Demographics Similar to Pueblo by In Labor Force | Age 35-44
In terms of in labor force | age 35-44, the demographic groups most similar to Pueblo are Yup'ik (77.3%, a difference of 0.10%), Lumbee (77.0%, a difference of 0.46%), Hopi (77.0%, a difference of 0.50%), Apache (77.9%, a difference of 0.70%), and Arapaho (78.1%, a difference of 0.91%).
| Demographics | Rating | Rank | In Labor Force | Age 35-44 |
| Houma | 0.0 /100 | #331 | Tragic 79.5% |
| Ute | 0.0 /100 | #332 | Tragic 79.4% |
| Kiowa | 0.0 /100 | #333 | Tragic 79.2% |
| Yakama | 0.0 /100 | #334 | Tragic 79.0% |
| Natives/Alaskans | 0.0 /100 | #335 | Tragic 78.9% |
| Arapaho | 0.0 /100 | #336 | Tragic 78.1% |
| Apache | 0.0 /100 | #337 | Tragic 77.9% |
| Pueblo | 0.0 /100 | #338 | Tragic 77.4% |
| Yup'ik | 0.0 /100 | #339 | Tragic 77.3% |
| Lumbee | 0.0 /100 | #340 | Tragic 77.0% |
| Hopi | 0.0 /100 | #341 | Tragic 77.0% |
| Crow | 0.0 /100 | #342 | Tragic 76.5% |
| Immigrants | Yemen | 0.0 /100 | #343 | Tragic 76.3% |
| Pima | 0.0 /100 | #344 | Tragic 74.8% |
| Yuman | 0.0 /100 | #345 | Tragic 74.7% |
Demographics Similar to Marshallese by In Labor Force | Age 35-44
In terms of in labor force | age 35-44, the demographic groups most similar to Marshallese are American (82.4%, a difference of 0.010%), Nepalese (82.4%, a difference of 0.010%), Spanish American Indian (82.5%, a difference of 0.080%), Central American Indian (82.5%, a difference of 0.11%), and Tlingit-Haida (82.5%, a difference of 0.17%).
| Demographics | Rating | Rank | In Labor Force | Age 35-44 |
| Hmong | 0.0 /100 | #297 | Tragic 82.6% |
| Ottawa | 0.0 /100 | #298 | Tragic 82.6% |
| Tlingit-Haida | 0.0 /100 | #299 | Tragic 82.5% |
| Central American Indians | 0.0 /100 | #300 | Tragic 82.5% |
| Spanish American Indians | 0.0 /100 | #301 | Tragic 82.5% |
| Americans | 0.0 /100 | #302 | Tragic 82.4% |
| Nepalese | 0.0 /100 | #303 | Tragic 82.4% |
| Marshallese | 0.0 /100 | #304 | Tragic 82.4% |
| Shoshone | 0.0 /100 | #305 | Tragic 82.2% |
| Blacks/African Americans | 0.0 /100 | #306 | Tragic 82.2% |
| Hispanics or Latinos | 0.0 /100 | #307 | Tragic 82.1% |
| Immigrants | Central America | 0.0 /100 | #308 | Tragic 82.0% |
| Cree | 0.0 /100 | #309 | Tragic 82.0% |
| Blackfeet | 0.0 /100 | #310 | Tragic 81.9% |
| Colville | 0.0 /100 | #311 | Tragic 81.7% |