Immigrants from Albania vs Immigrants from Sri Lanka In Labor Force | Age 35-44
COMPARE
Immigrants from Albania
Immigrants from Sri Lanka
In Labor Force | Age 35-44
In Labor Force | Age 35-44 Comparison
Immigrants from Albania
Immigrants from Sri Lanka
85.1%
IN LABOR FORCE | AGE 35-44
99.7/ 100
METRIC RATING
51st/ 347
METRIC RANK
85.0%
IN LABOR FORCE | AGE 35-44
98.9/ 100
METRIC RATING
73rd/ 347
METRIC RANK
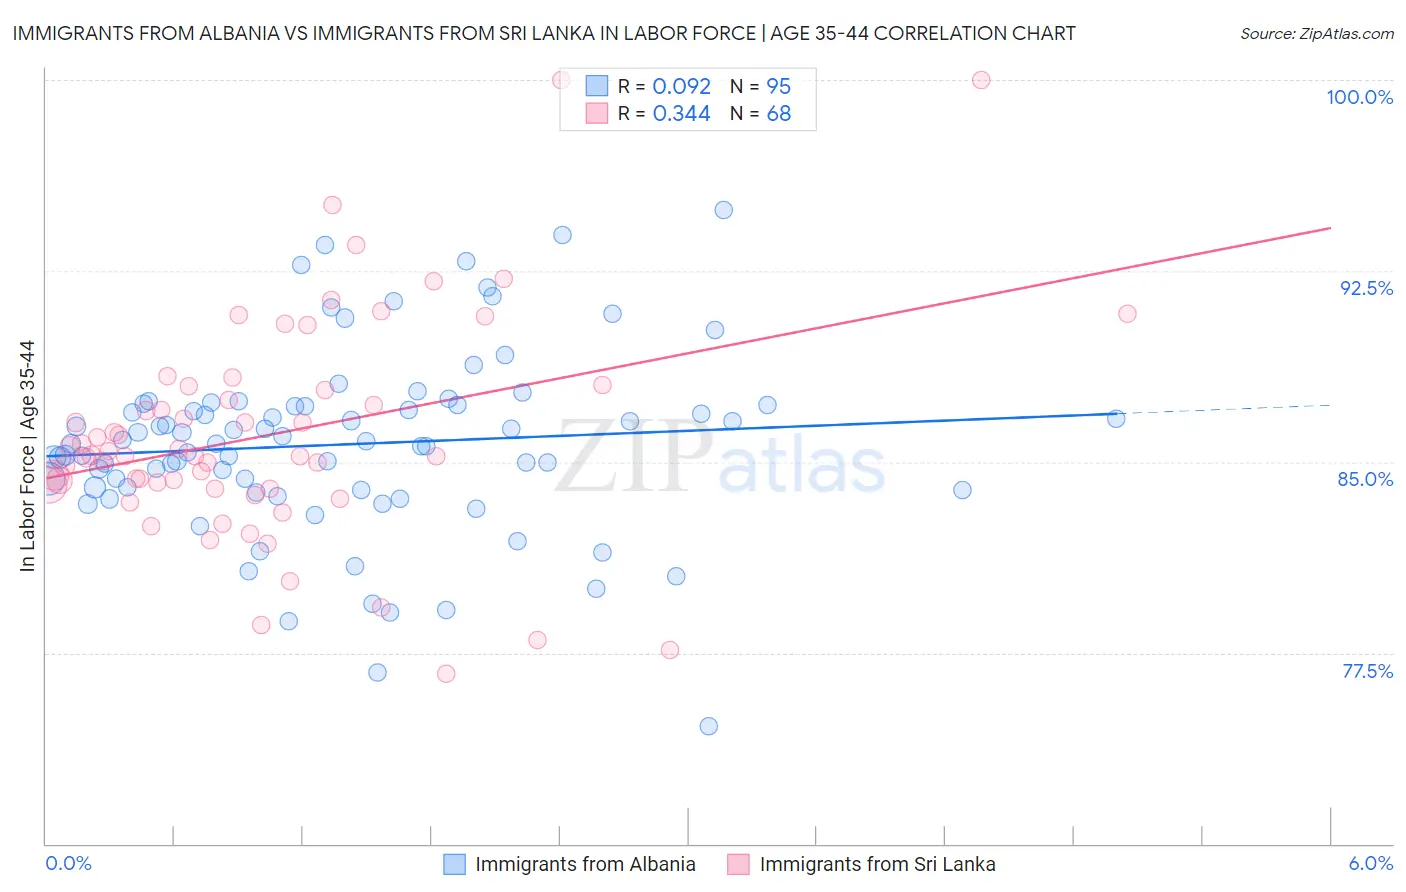
Immigrants from Albania vs Immigrants from Sri Lanka In Labor Force | Age 35-44 Correlation Chart
The statistical analysis conducted on geographies consisting of 119,387,353 people shows a slight positive correlation between the proportion of Immigrants from Albania and labor force participation rate among population between the ages 35 and 44 in the United States with a correlation coefficient (R) of 0.092 and weighted average of 85.1%. Similarly, the statistical analysis conducted on geographies consisting of 149,678,002 people shows a mild positive correlation between the proportion of Immigrants from Sri Lanka and labor force participation rate among population between the ages 35 and 44 in the United States with a correlation coefficient (R) of 0.344 and weighted average of 85.0%, a difference of 0.20%.
In Labor Force | Age 35-44 Correlation Summary
| Measurement | Immigrants from Albania | Immigrants from Sri Lanka |
| Minimum | 74.6% | 76.7% |
| Maximum | 94.9% | 100.0% |
| Range | 20.3% | 23.3% |
| Mean | 85.7% | 86.1% |
| Median | 85.7% | 85.2% |
| Interquartile 25% (IQ1) | 83.9% | 84.0% |
| Interquartile 75% (IQ3) | 87.2% | 87.9% |
| Interquartile Range (IQR) | 3.3% | 3.9% |
| Standard Deviation (Sample) | 3.6% | 4.4% |
| Standard Deviation (Population) | 3.6% | 4.4% |
Similar Demographics by In Labor Force | Age 35-44
Demographics Similar to Immigrants from Albania by In Labor Force | Age 35-44
In terms of in labor force | age 35-44, the demographic groups most similar to Immigrants from Albania are Thai (85.2%, a difference of 0.0%), Croatian (85.2%, a difference of 0.030%), Immigrants from Kenya (85.1%, a difference of 0.030%), Immigrants from Eritrea (85.2%, a difference of 0.040%), and Taiwanese (85.1%, a difference of 0.040%).
| Demographics | Rating | Rank | In Labor Force | Age 35-44 |
| Lithuanians | 99.8 /100 | #44 | Exceptional 85.2% |
| Cypriots | 99.8 /100 | #45 | Exceptional 85.2% |
| Immigrants | Hong Kong | 99.8 /100 | #46 | Exceptional 85.2% |
| German Russians | 99.8 /100 | #47 | Exceptional 85.2% |
| Immigrants | Eritrea | 99.7 /100 | #48 | Exceptional 85.2% |
| Croatians | 99.7 /100 | #49 | Exceptional 85.2% |
| Thais | 99.7 /100 | #50 | Exceptional 85.2% |
| Immigrants | Albania | 99.7 /100 | #51 | Exceptional 85.1% |
| Immigrants | Kenya | 99.6 /100 | #52 | Exceptional 85.1% |
| Taiwanese | 99.6 /100 | #53 | Exceptional 85.1% |
| Turks | 99.5 /100 | #54 | Exceptional 85.1% |
| Soviet Union | 99.5 /100 | #55 | Exceptional 85.1% |
| Immigrants | Croatia | 99.5 /100 | #56 | Exceptional 85.1% |
| Chinese | 99.4 /100 | #57 | Exceptional 85.1% |
| Slovaks | 99.4 /100 | #58 | Exceptional 85.1% |
Demographics Similar to Immigrants from Sri Lanka by In Labor Force | Age 35-44
In terms of in labor force | age 35-44, the demographic groups most similar to Immigrants from Sri Lanka are Immigrants from Singapore (85.0%, a difference of 0.0%), Colombian (85.0%, a difference of 0.010%), Brazilian (85.0%, a difference of 0.020%), Russian (85.0%, a difference of 0.020%), and Immigrants from South Central Asia (85.0%, a difference of 0.020%).
| Demographics | Rating | Rank | In Labor Force | Age 35-44 |
| Immigrants | Haiti | 99.1 /100 | #66 | Exceptional 85.0% |
| Immigrants | Italy | 99.1 /100 | #67 | Exceptional 85.0% |
| Italians | 99.1 /100 | #68 | Exceptional 85.0% |
| Sudanese | 99.0 /100 | #69 | Exceptional 85.0% |
| Brazilians | 99.0 /100 | #70 | Exceptional 85.0% |
| Russians | 99.0 /100 | #71 | Exceptional 85.0% |
| Immigrants | Singapore | 98.9 /100 | #72 | Exceptional 85.0% |
| Immigrants | Sri Lanka | 98.9 /100 | #73 | Exceptional 85.0% |
| Colombians | 98.8 /100 | #74 | Exceptional 85.0% |
| Immigrants | South Central Asia | 98.7 /100 | #75 | Exceptional 85.0% |
| Immigrants | Cuba | 98.6 /100 | #76 | Exceptional 84.9% |
| Immigrants | Turkey | 98.6 /100 | #77 | Exceptional 84.9% |
| Immigrants | Africa | 98.4 /100 | #78 | Exceptional 84.9% |
| Peruvians | 98.3 /100 | #79 | Exceptional 84.9% |
| Immigrants | Colombia | 98.3 /100 | #80 | Exceptional 84.9% |