Immigrants from Albania vs Immigrants from Nepal In Labor Force | Age 35-44
COMPARE
Immigrants from Albania
Immigrants from Nepal
In Labor Force | Age 35-44
In Labor Force | Age 35-44 Comparison
Immigrants from Albania
Immigrants from Nepal
85.1%
IN LABOR FORCE | AGE 35-44
99.7/ 100
METRIC RATING
51st/ 347
METRIC RANK
85.3%
IN LABOR FORCE | AGE 35-44
99.9/ 100
METRIC RATING
34th/ 347
METRIC RANK
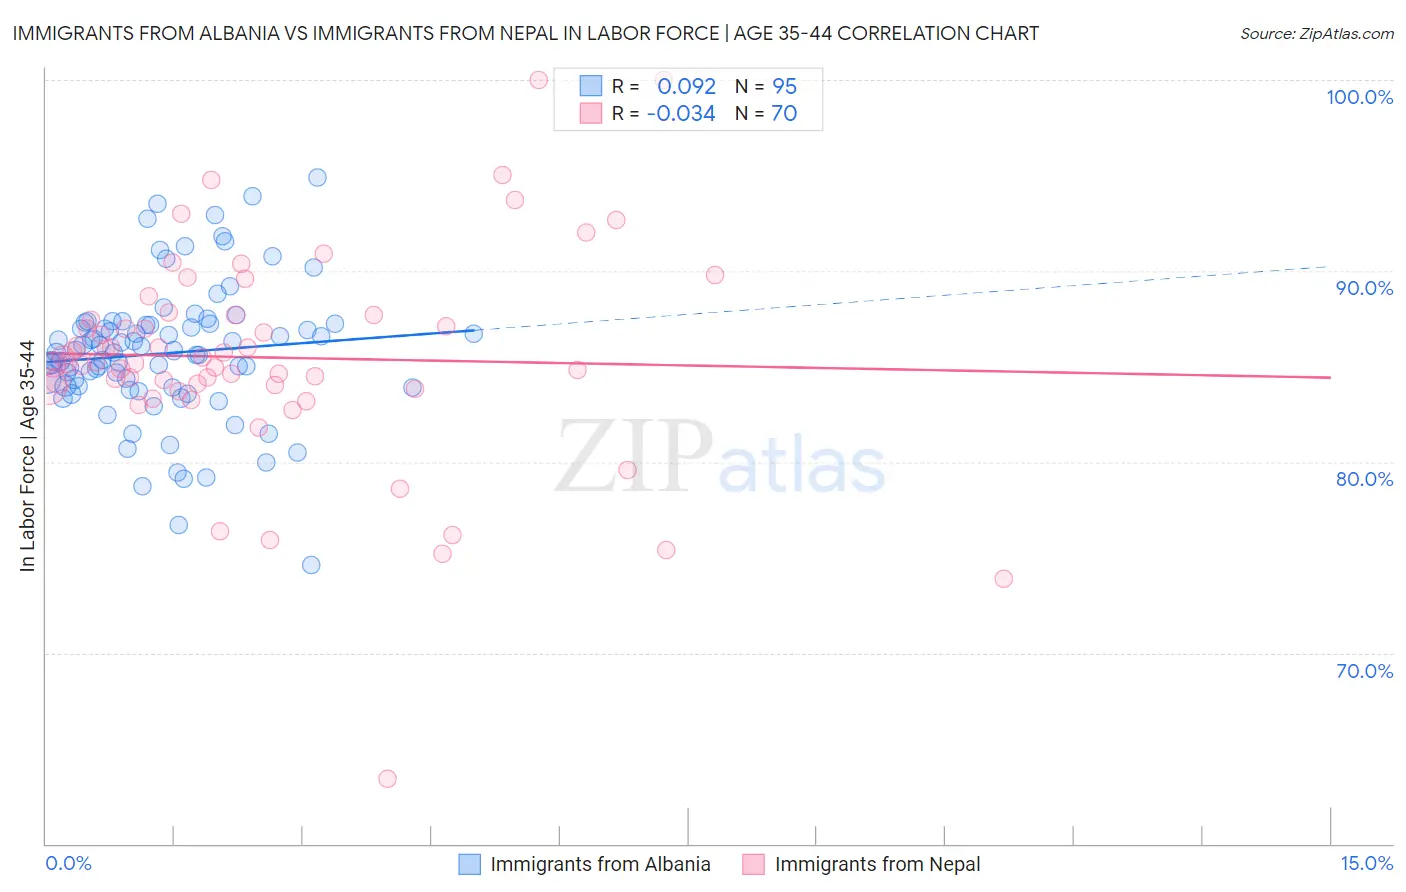
Immigrants from Albania vs Immigrants from Nepal In Labor Force | Age 35-44 Correlation Chart
The statistical analysis conducted on geographies consisting of 119,387,353 people shows a slight positive correlation between the proportion of Immigrants from Albania and labor force participation rate among population between the ages 35 and 44 in the United States with a correlation coefficient (R) of 0.092 and weighted average of 85.1%. Similarly, the statistical analysis conducted on geographies consisting of 186,726,251 people shows no correlation between the proportion of Immigrants from Nepal and labor force participation rate among population between the ages 35 and 44 in the United States with a correlation coefficient (R) of -0.034 and weighted average of 85.3%, a difference of 0.14%.
In Labor Force | Age 35-44 Correlation Summary
| Measurement | Immigrants from Albania | Immigrants from Nepal |
| Minimum | 74.6% | 63.4% |
| Maximum | 94.9% | 100.0% |
| Range | 20.3% | 36.6% |
| Mean | 85.7% | 85.5% |
| Median | 85.7% | 85.2% |
| Interquartile 25% (IQ1) | 83.9% | 83.9% |
| Interquartile 75% (IQ3) | 87.2% | 87.7% |
| Interquartile Range (IQR) | 3.3% | 3.8% |
| Standard Deviation (Sample) | 3.6% | 5.7% |
| Standard Deviation (Population) | 3.6% | 5.6% |
Demographics Similar to Immigrants from Albania and Immigrants from Nepal by In Labor Force | Age 35-44
In terms of in labor force | age 35-44, the demographic groups most similar to Immigrants from Albania are Thai (85.2%, a difference of 0.0%), Croatian (85.2%, a difference of 0.030%), Immigrants from Kenya (85.1%, a difference of 0.030%), Immigrants from Eritrea (85.2%, a difference of 0.040%), and German Russian (85.2%, a difference of 0.050%). Similarly, the demographic groups most similar to Immigrants from Nepal are Estonian (85.3%, a difference of 0.0%), Ugandan (85.3%, a difference of 0.020%), Immigrants from India (85.3%, a difference of 0.030%), Immigrants from Morocco (85.2%, a difference of 0.030%), and Kenyan (85.2%, a difference of 0.040%).
| Demographics | Rating | Rank | In Labor Force | Age 35-44 |
| Immigrants | India | 99.9 /100 | #32 | Exceptional 85.3% |
| Ugandans | 99.9 /100 | #33 | Exceptional 85.3% |
| Immigrants | Nepal | 99.9 /100 | #34 | Exceptional 85.3% |
| Estonians | 99.9 /100 | #35 | Exceptional 85.3% |
| Immigrants | Morocco | 99.8 /100 | #36 | Exceptional 85.2% |
| Kenyans | 99.8 /100 | #37 | Exceptional 85.2% |
| Immigrants | Poland | 99.8 /100 | #38 | Exceptional 85.2% |
| Eastern Europeans | 99.8 /100 | #39 | Exceptional 85.2% |
| Immigrants | Bulgaria | 99.8 /100 | #40 | Exceptional 85.2% |
| Immigrants | Zimbabwe | 99.8 /100 | #41 | Exceptional 85.2% |
| Macedonians | 99.8 /100 | #42 | Exceptional 85.2% |
| Poles | 99.8 /100 | #43 | Exceptional 85.2% |
| Lithuanians | 99.8 /100 | #44 | Exceptional 85.2% |
| Cypriots | 99.8 /100 | #45 | Exceptional 85.2% |
| Immigrants | Hong Kong | 99.8 /100 | #46 | Exceptional 85.2% |
| German Russians | 99.8 /100 | #47 | Exceptional 85.2% |
| Immigrants | Eritrea | 99.7 /100 | #48 | Exceptional 85.2% |
| Croatians | 99.7 /100 | #49 | Exceptional 85.2% |
| Thais | 99.7 /100 | #50 | Exceptional 85.2% |
| Immigrants | Albania | 99.7 /100 | #51 | Exceptional 85.1% |
| Immigrants | Kenya | 99.6 /100 | #52 | Exceptional 85.1% |