Icelander vs Pima In Labor Force | Age 35-44
COMPARE
Icelander
Pima
In Labor Force | Age 35-44
In Labor Force | Age 35-44 Comparison
Icelanders
Pima
84.0%
IN LABOR FORCE | AGE 35-44
6.7/ 100
METRIC RATING
221st/ 347
METRIC RANK
74.8%
IN LABOR FORCE | AGE 35-44
0.0/ 100
METRIC RATING
344th/ 347
METRIC RANK
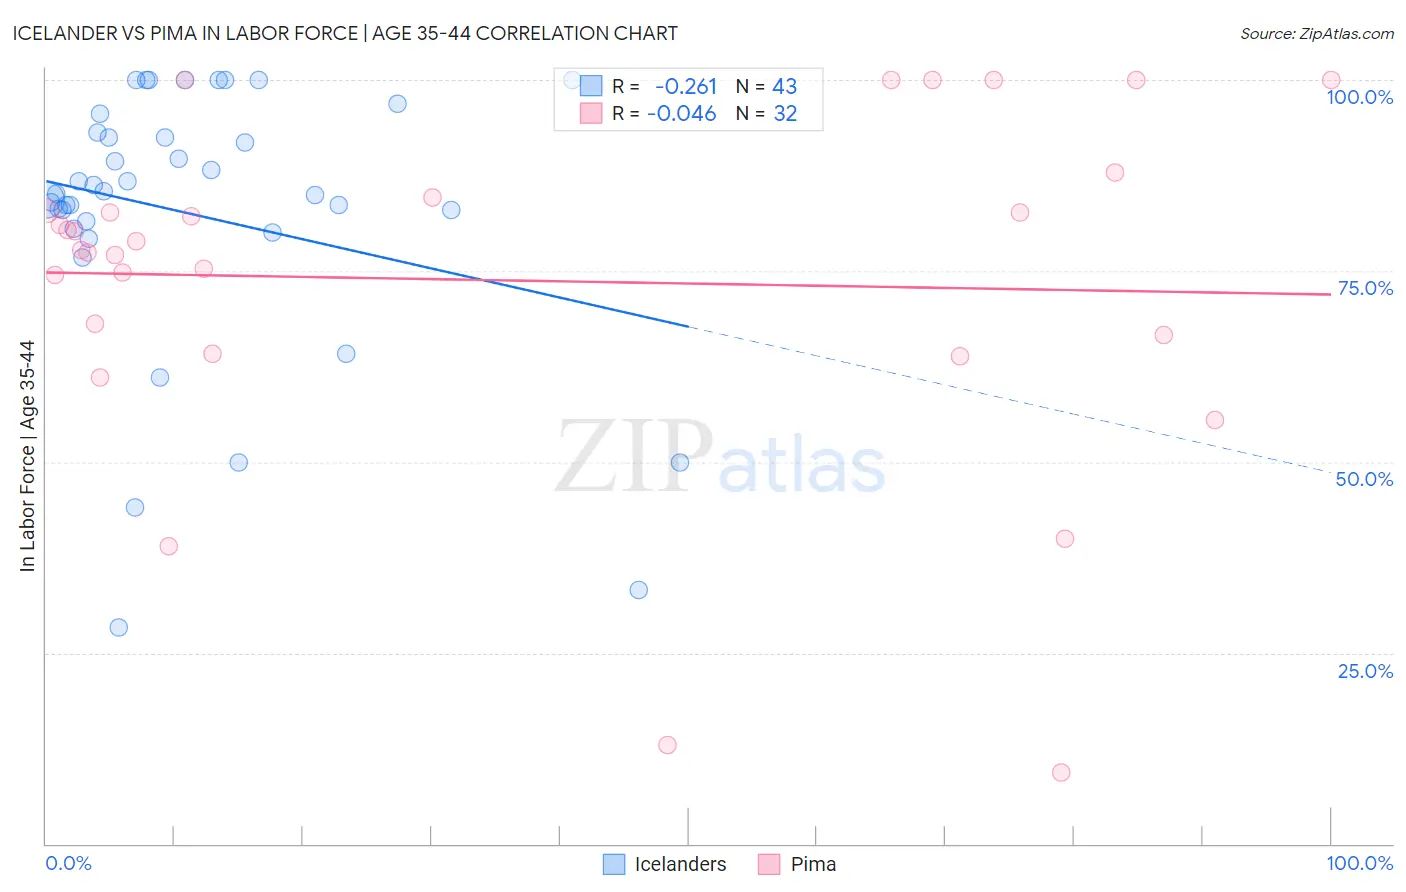
Icelander vs Pima In Labor Force | Age 35-44 Correlation Chart
The statistical analysis conducted on geographies consisting of 159,631,380 people shows a weak negative correlation between the proportion of Icelanders and labor force participation rate among population between the ages 35 and 44 in the United States with a correlation coefficient (R) of -0.261 and weighted average of 84.0%. Similarly, the statistical analysis conducted on geographies consisting of 61,535,254 people shows no correlation between the proportion of Pima and labor force participation rate among population between the ages 35 and 44 in the United States with a correlation coefficient (R) of -0.046 and weighted average of 74.8%, a difference of 12.3%.
In Labor Force | Age 35-44 Correlation Summary
| Measurement | Icelander | Pima |
| Minimum | 28.2% | 9.3% |
| Maximum | 100.0% | 100.0% |
| Range | 71.8% | 90.7% |
| Mean | 82.4% | 73.8% |
| Median | 85.1% | 78.3% |
| Interquartile 25% (IQ1) | 80.4% | 65.4% |
| Interquartile 75% (IQ3) | 93.1% | 83.7% |
| Interquartile Range (IQR) | 12.7% | 18.4% |
| Standard Deviation (Sample) | 17.8% | 22.7% |
| Standard Deviation (Population) | 17.6% | 22.3% |
Similar Demographics by In Labor Force | Age 35-44
Demographics Similar to Icelanders by In Labor Force | Age 35-44
In terms of in labor force | age 35-44, the demographic groups most similar to Icelanders are Assyrian/Chaldean/Syriac (84.0%, a difference of 0.0%), Immigrants from Panama (84.0%, a difference of 0.010%), French (84.0%, a difference of 0.020%), U.S. Virgin Islander (84.0%, a difference of 0.020%), and Immigrants from Burma/Myanmar (84.0%, a difference of 0.020%).
| Demographics | Rating | Rank | In Labor Force | Age 35-44 |
| Immigrants | Barbados | 13.2 /100 | #214 | Poor 84.1% |
| Europeans | 12.2 /100 | #215 | Poor 84.1% |
| Nicaraguans | 12.1 /100 | #216 | Poor 84.1% |
| Immigrants | Norway | 11.7 /100 | #217 | Poor 84.1% |
| Immigrants | Nicaragua | 9.4 /100 | #218 | Tragic 84.1% |
| Sub-Saharan Africans | 9.3 /100 | #219 | Tragic 84.1% |
| French | 7.5 /100 | #220 | Tragic 84.0% |
| Icelanders | 6.7 /100 | #221 | Tragic 84.0% |
| Assyrians/Chaldeans/Syriacs | 6.6 /100 | #222 | Tragic 84.0% |
| Immigrants | Panama | 6.4 /100 | #223 | Tragic 84.0% |
| U.S. Virgin Islanders | 6.1 /100 | #224 | Tragic 84.0% |
| Immigrants | Burma/Myanmar | 6.1 /100 | #225 | Tragic 84.0% |
| Panamanians | 5.4 /100 | #226 | Tragic 84.0% |
| British West Indians | 5.3 /100 | #227 | Tragic 84.0% |
| Welsh | 5.3 /100 | #228 | Tragic 84.0% |
Demographics Similar to Pima by In Labor Force | Age 35-44
In terms of in labor force | age 35-44, the demographic groups most similar to Pima are Yuman (74.7%, a difference of 0.13%), Tohono O'odham (74.1%, a difference of 0.96%), Navajo (73.8%, a difference of 1.3%), Immigrants from Yemen (76.3%, a difference of 1.9%), and Crow (76.5%, a difference of 2.2%).
| Demographics | Rating | Rank | In Labor Force | Age 35-44 |
| Kiowa | 0.0 /100 | #333 | Tragic 79.2% |
| Yakama | 0.0 /100 | #334 | Tragic 79.0% |
| Natives/Alaskans | 0.0 /100 | #335 | Tragic 78.9% |
| Arapaho | 0.0 /100 | #336 | Tragic 78.1% |
| Apache | 0.0 /100 | #337 | Tragic 77.9% |
| Pueblo | 0.0 /100 | #338 | Tragic 77.4% |
| Yup'ik | 0.0 /100 | #339 | Tragic 77.3% |
| Lumbee | 0.0 /100 | #340 | Tragic 77.0% |
| Hopi | 0.0 /100 | #341 | Tragic 77.0% |
| Crow | 0.0 /100 | #342 | Tragic 76.5% |
| Immigrants | Yemen | 0.0 /100 | #343 | Tragic 76.3% |
| Pima | 0.0 /100 | #344 | Tragic 74.8% |
| Yuman | 0.0 /100 | #345 | Tragic 74.7% |
| Tohono O'odham | 0.0 /100 | #346 | Tragic 74.1% |
| Navajo | 0.0 /100 | #347 | Tragic 73.8% |