Icelander vs Immigrants from Denmark In Labor Force | Age 35-44

COMPARE

Icelander
Race
Ancestry
AfghanAfricanAlaska NativeAlaskan AthabascanAlbanianAleutAlsatianAmericanApacheArabArapahoArgentineanArmenianAssyrian/Chaldean/SyriacAustralianAustrianBahamianBangladeshiBarbadianBasqueBelgianBelizeanBermudanBhutaneseBlackfeetBolivianBrazilianBritishBritish West IndianBulgarianBurmeseCajunCambodianCanadianCape VerdeanCarpatho RusynCelticCentral AmericanCentral American IndianCherokeeCheyenneChickasawChileanChineseChippewaChoctawColombianColvilleComancheCosta RicanCreeCreekCroatianCrowCubanCypriotCzechCzechoslovakianDanishDelawareDominicanDutchDutch West IndianEastern EuropeanEcuadorianEgyptianEnglishEstonianEthiopianEuropeanFijianFilipinoFinnishFrenchFrench American IndianFrench CanadianGermanGerman RussianGhanaianGreekGuamanian/ChamorroGuatemalanGuyaneseHaitianHmongHonduranHopiHoumaHungarianIcelanderIndian (Asian)IndonesianInupiatIranianIraqiIrishIroquoisIsraeliItalianJamaicanJapaneseJordanianKenyanKiowaKoreanLaotianLatvianLebaneseLiberianLithuanianLumbeeLuxembourgerMacedonianMalaysianMalteseMarshalleseMenomineeMexicanMexican American IndianMongolianMoroccanNative HawaiianNavajoNepaleseNew ZealanderNicaraguanNigerianNorthern EuropeanNorwegianOkinawanOsageOttawaPaiutePakistaniPalestinianPanamanianParaguayanPennsylvania GermanPeruvianPimaPolishPortuguesePotawatomiPuebloPuerto RicanPuget Sound SalishRomanianRussianSalvadoranSamoanScandinavianScotch-IrishScottishSeminoleSenegaleseSerbianShoshoneSierra LeoneanSiouxSlavicSlovakSloveneSomaliSouth AfricanSouth AmericanSouth American IndianSoviet UnionSpaniardSpanishSpanish AmericanSpanish American IndianSri LankanSubsaharan AfricanSudaneseSwedishSwissSyrianTaiwaneseThaiTlingit-HaidaTohono O'OdhamTonganTrinidadian and TobagonianTsimshianTurkishU.S. Virgin IslanderUgandanUkrainianUruguayanUteVenezuelanVietnameseWelshWest IndianYakamaYaquiYugoslavianYumanYup'ikZimbabwean
Immigration
NonimmigrantsImmigrantsAfghanistanAfricaAlbaniaArgentinaArmeniaAsiaAustraliaAustriaBahamasBangladeshBarbadosBelarusBelgiumBelizeBoliviaBosnia and HerzegovinaBrazilBulgariaBurma/MyanmarCabo VerdeCambodiaCameroonCanadaCaribbeanCentral AmericaChileChinaColombiaCongoCosta RicaCroatiaCubaCzechoslovakiaDominicaDominican RepublicEastern AfricaEastern AsiaEastern EuropeEcuadorEgyptEl SalvadorEnglandEritreaEthiopiaEuropeFijiFranceGermanyGhanaGreeceGrenadaGuatemalaGuyanaHaitiHondurasHong KongHungaryIndiaIndonesiaIranIraqIrelandIsraelItalyJamaicaJapanJordanKazakhstanKenyaKoreaKuwaitLaosLatin AmericaLatviaLebanonLiberiaLithuaniaMalaysiaMexicoMicronesiaMiddle AfricaMoldovaMoroccoNepalNetherlandsNicaraguaNigeriaNorth AmericaNorth MacedoniaNorthern AfricaNorthern EuropeNorwayOceaniaPakistanPanamaPeruPhilippinesPolandPortugalRomaniaRussiaSaudi ArabiaScotlandSenegalSerbiaSierra LeoneSingaporeSomaliaSouth AfricaSouth AmericaSouth Central AsiaSouth Eastern AsiaSouthern EuropeSpainSri LankaSt. Vincent and the GrenadinesSudanSwedenSwitzerlandSyriaTaiwanThailandTrinidad and TobagoTurkeyUgandaUkraineUruguayUzbekistanVenezuelaVietnamWest IndiesWestern AfricaWestern AsiaWestern EuropeYemenZaireZimbabweAzores
Immigrants from Denmark
Race
Ancestry
AfghanAfricanAlaska NativeAlaskan AthabascanAlbanianAleutAlsatianAmericanApacheArabArapahoArgentineanArmenianAssyrian/Chaldean/SyriacAustralianAustrianBahamianBangladeshiBarbadianBasqueBelgianBelizeanBermudanBhutaneseBlackfeetBolivianBrazilianBritishBritish West IndianBulgarianBurmeseCajunCambodianCanadianCape VerdeanCarpatho RusynCelticCentral AmericanCentral American IndianCherokeeCheyenneChickasawChileanChineseChippewaChoctawColombianColvilleComancheCosta RicanCreeCreekCroatianCrowCubanCypriotCzechCzechoslovakianDanishDelawareDominicanDutchDutch West IndianEastern EuropeanEcuadorianEgyptianEnglishEstonianEthiopianEuropeanFijianFilipinoFinnishFrenchFrench American IndianFrench CanadianGermanGerman RussianGhanaianGreekGuamanian/ChamorroGuatemalanGuyaneseHaitianHmongHonduranHopiHoumaHungarianIndian (Asian)IndonesianInupiatIranianIraqiIrishIroquoisIsraeliItalianJamaicanJapaneseJordanianKenyanKiowaKoreanLaotianLatvianLebaneseLiberianLithuanianLumbeeLuxembourgerMacedonianMalaysianMalteseMarshalleseMenomineeMexicanMexican American IndianMongolianMoroccanNative HawaiianNavajoNepaleseNew ZealanderNicaraguanNigerianNorthern EuropeanNorwegianOkinawanOsageOttawaPaiutePakistaniPalestinianPanamanianParaguayanPennsylvania GermanPeruvianPimaPolishPortuguesePotawatomiPuebloPuerto RicanPuget Sound SalishRomanianRussianSalvadoranSamoanScandinavianScotch-IrishScottishSeminoleSenegaleseSerbianShoshoneSierra LeoneanSiouxSlavicSlovakSloveneSomaliSouth AfricanSouth AmericanSouth American IndianSoviet UnionSpaniardSpanishSpanish AmericanSpanish American IndianSri LankanSubsaharan AfricanSudaneseSwedishSwissSyrianTaiwaneseThaiTlingit-HaidaTohono O'OdhamTonganTrinidadian and TobagonianTsimshianTurkishU.S. Virgin IslanderUgandanUkrainianUruguayanUteVenezuelanVietnameseWelshWest IndianYakamaYaquiYugoslavianYumanYup'ikZimbabwean
Immigration
NonimmigrantsImmigrantsAfghanistanAfricaAlbaniaArgentinaArmeniaAsiaAustraliaAustriaBahamasBangladeshBarbadosBelarusBelgiumBelizeBoliviaBosnia and HerzegovinaBrazilBulgariaBurma/MyanmarCabo VerdeCambodiaCameroonCanadaCaribbeanCentral AmericaChileChinaColombiaCongoCosta RicaCroatiaCubaCzechoslovakiaDenmarkDominicaDominican RepublicEastern AfricaEastern AsiaEastern EuropeEcuadorEgyptEl SalvadorEnglandEritreaEthiopiaEuropeFijiFranceGermanyGhanaGreeceGrenadaGuatemalaGuyanaHaitiHondurasHong KongHungaryIndiaIndonesiaIranIraqIrelandIsraelItalyJamaicaJapanJordanKazakhstanKenyaKoreaKuwaitLaosLatin AmericaLatviaLebanonLiberiaLithuaniaMalaysiaMexicoMicronesiaMiddle AfricaMoldovaMoroccoNepalNetherlandsNicaraguaNigeriaNorth AmericaNorth MacedoniaNorthern AfricaNorthern EuropeNorwayOceaniaPakistanPanamaPeruPhilippinesPolandPortugalRomaniaRussiaSaudi ArabiaScotlandSenegalSerbiaSierra LeoneSingaporeSomaliaSouth AfricaSouth AmericaSouth Central AsiaSouth Eastern AsiaSouthern EuropeSpainSri LankaSt. Vincent and the GrenadinesSudanSwedenSwitzerlandSyriaTaiwanThailandTrinidad and TobagoTurkeyUgandaUkraineUruguayUzbekistanVenezuelaVietnamWest IndiesWestern AfricaWestern AsiaWestern EuropeYemenZaireZimbabweAzores
In Labor Force | Age 35-44
Income
Poverty
Unemployment
Labor Participation
Family Structure
Vehicle Availability
Education Level
Disability

In Labor Force | Age 35-44 Comparison

Icelanders

Immigrants from Denmark

Tragic
Fair
84.0%
IN LABOR FORCE | AGE 35-44
6.7/ 100
METRIC RATING
221st/ 347
METRIC RANK
84.3%
IN LABOR FORCE | AGE 35-44
33.7/ 100
METRIC RATING
189th/ 347
METRIC RANK

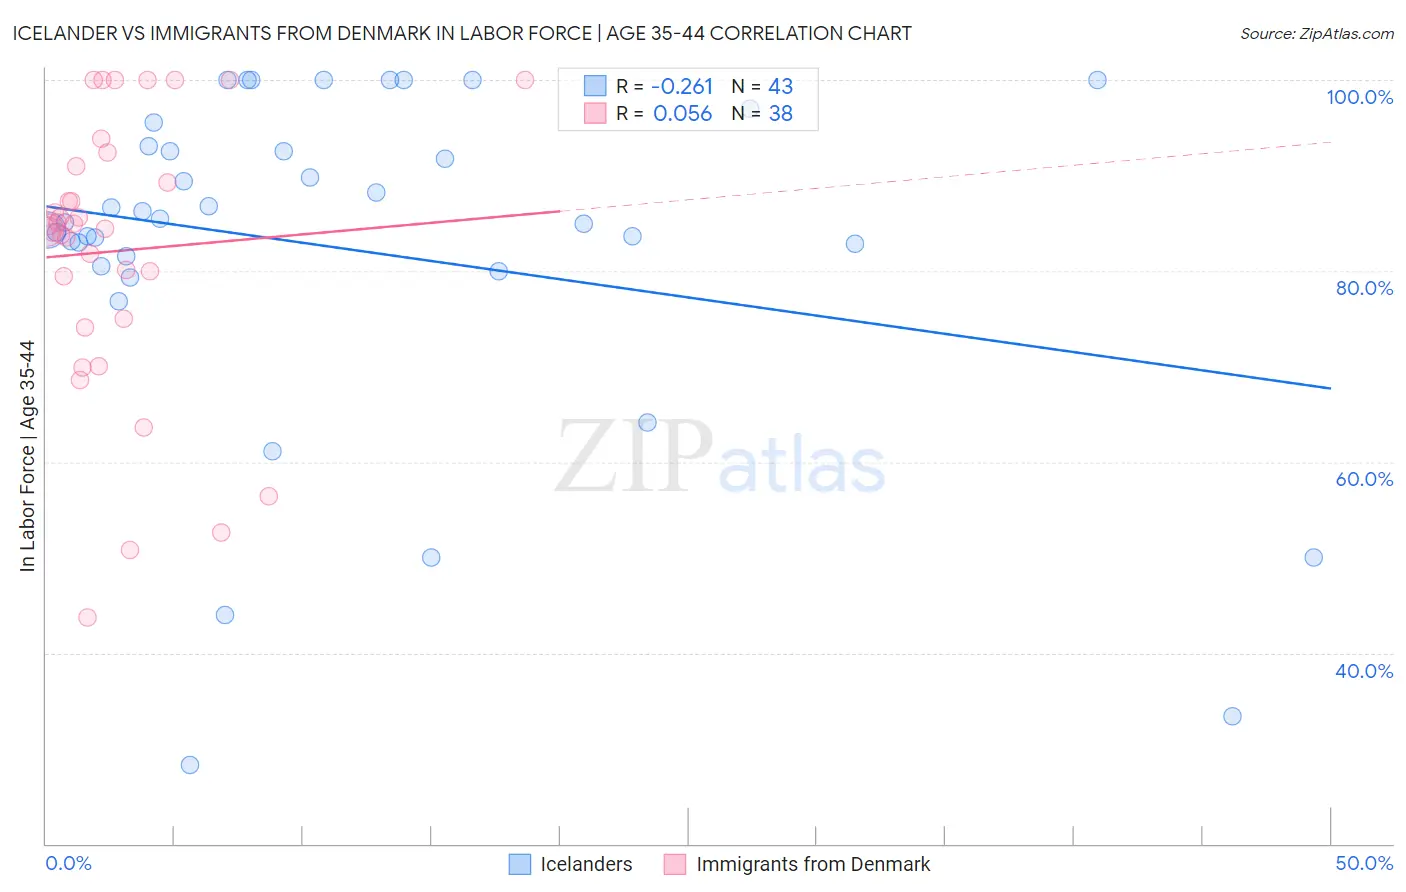
Icelander vs Immigrants from Denmark In Labor Force | Age 35-44 Correlation Chart

The statistical analysis conducted on geographies consisting of 159,631,380 people shows a weak negative correlation between the proportion of Icelanders and labor force participation rate among population between the ages 35 and 44 in the United States with a correlation coefficient (R) of -0.261 and weighted average of 84.0%. Similarly, the statistical analysis conducted on geographies consisting of 136,414,422 people shows a slight positive correlation between the proportion of Immigrants from Denmark and labor force participation rate among population between the ages 35 and 44 in the United States with a correlation coefficient (R) of 0.056 and weighted average of 84.3%, a difference of 0.32%.
Icelander vs Immigrants from Denmark In Labor Force | Age 35-44

In Labor Force | Age 35-44 Correlation Summary

MeasurementIcelanderImmigrants from Denmark
Minimum28.2%43.7%
Maximum100.0%100.0%
Range71.8%56.3%
Mean82.4%82.1%
Median85.1%84.6%
Interquartile 25% (IQ1)80.4%75.0%
Interquartile 75% (IQ3)93.1%91.0%
Interquartile Range (IQR)12.7%16.0%
Standard Deviation (Sample)17.8%14.4%
Standard Deviation (Population)17.6%14.2%

Similar Demographics by In Labor Force | Age 35-44

Demographics Similar to Icelanders by In Labor Force | Age 35-44

In terms of in labor force | age 35-44, the demographic groups most similar to Icelanders are Assyrian/Chaldean/Syriac (84.0%, a difference of 0.0%), Immigrants from Panama (84.0%, a difference of 0.010%), French (84.0%, a difference of 0.020%), U.S. Virgin Islander (84.0%, a difference of 0.020%), and Immigrants from Burma/Myanmar (84.0%, a difference of 0.020%).
DemographicsRating | RankIn Labor Force | Age 35-44
Immigrants | Barbados
13.2
/100
|
#214
Poor
84.1%
Europeans
12.2
/100
|
#215
Poor
84.1%
Nicaraguans
12.1
/100
|
#216
Poor
84.1%
Immigrants | Norway
11.7
/100
|
#217
Poor
84.1%
Immigrants | Nicaragua
9.4
/100
|
#218
Tragic
84.1%
Sub-Saharan Africans
9.3
/100
|
#219
Tragic
84.1%
French
7.5
/100
|
#220
Tragic
84.0%
Icelanders
6.7
/100
|
#221
Tragic
84.0%
Assyrians/Chaldeans/Syriacs
6.6
/100
|
#222
Tragic
84.0%
Immigrants | Panama
6.4
/100
|
#223
Tragic
84.0%
U.S. Virgin Islanders
6.1
/100
|
#224
Tragic
84.0%
Immigrants | Burma/Myanmar
6.1
/100
|
#225
Tragic
84.0%
Panamanians
5.4
/100
|
#226
Tragic
84.0%
British West Indians
5.3
/100
|
#227
Tragic
84.0%
Welsh
5.3
/100
|
#228
Tragic
84.0%

Demographics Similar to Immigrants from Denmark by In Labor Force | Age 35-44

In terms of in labor force | age 35-44, the demographic groups most similar to Immigrants from Denmark are South African (84.3%, a difference of 0.0%), Armenian (84.3%, a difference of 0.010%), Costa Rican (84.3%, a difference of 0.010%), Australian (84.3%, a difference of 0.010%), and Dutch (84.3%, a difference of 0.010%).
DemographicsRating | RankIn Labor Force | Age 35-44
Koreans
36.3
/100
|
#182
Fair
84.3%
Barbadians
36.2
/100
|
#183
Fair
84.3%
Armenians
35.6
/100
|
#184
Fair
84.3%
Costa Ricans
35.3
/100
|
#185
Fair
84.3%
Australians
35.1
/100
|
#186
Fair
84.3%
Dutch
34.8
/100
|
#187
Fair
84.3%
South Africans
34.1
/100
|
#188
Fair
84.3%
Immigrants | Denmark
33.7
/100
|
#189
Fair
84.3%
Portuguese
31.9
/100
|
#190
Fair
84.3%
Immigrants | Philippines
27.9
/100
|
#191
Fair
84.2%
Immigrants | Vietnam
27.4
/100
|
#192
Fair
84.2%
Hungarians
26.8
/100
|
#193
Fair
84.2%
Immigrants | Indonesia
25.7
/100
|
#194
Fair
84.2%
Immigrants | Caribbean
25.7
/100
|
#195
Fair
84.2%
Immigrants | England
25.0
/100
|
#196
Fair
84.2%