Icelander vs Immigrants from Uzbekistan In Labor Force | Age 35-44
COMPARE
Icelander
Immigrants from Uzbekistan
In Labor Force | Age 35-44
In Labor Force | Age 35-44 Comparison
Icelanders
Immigrants from Uzbekistan
84.0%
IN LABOR FORCE | AGE 35-44
6.7/ 100
METRIC RATING
221st/ 347
METRIC RANK
84.2%
IN LABOR FORCE | AGE 35-44
22.8/ 100
METRIC RATING
202nd/ 347
METRIC RANK
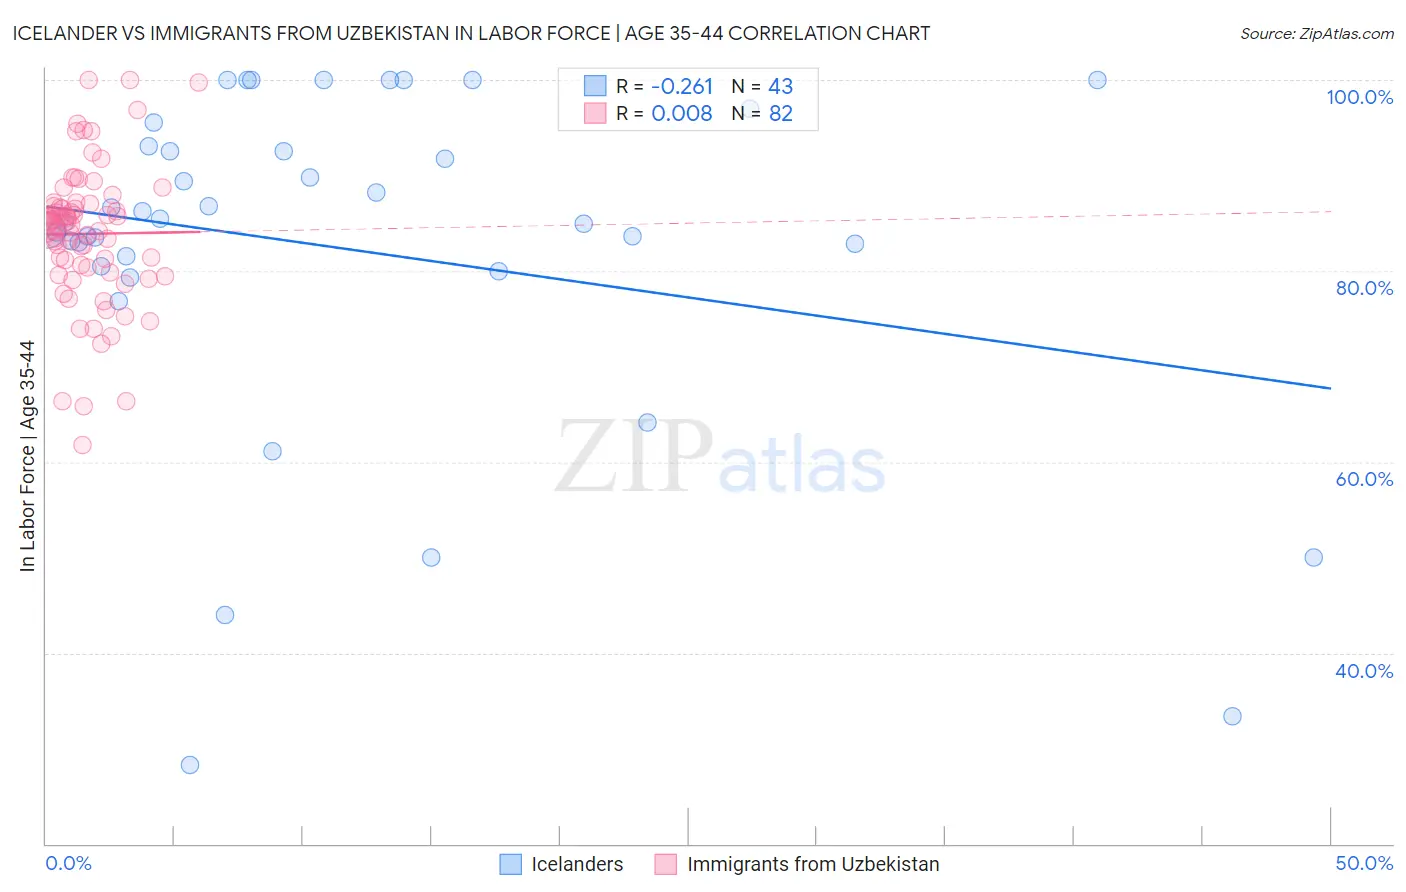
Icelander vs Immigrants from Uzbekistan In Labor Force | Age 35-44 Correlation Chart
The statistical analysis conducted on geographies consisting of 159,631,380 people shows a weak negative correlation between the proportion of Icelanders and labor force participation rate among population between the ages 35 and 44 in the United States with a correlation coefficient (R) of -0.261 and weighted average of 84.0%. Similarly, the statistical analysis conducted on geographies consisting of 118,733,606 people shows no correlation between the proportion of Immigrants from Uzbekistan and labor force participation rate among population between the ages 35 and 44 in the United States with a correlation coefficient (R) of 0.008 and weighted average of 84.2%, a difference of 0.23%.
In Labor Force | Age 35-44 Correlation Summary
| Measurement | Icelander | Immigrants from Uzbekistan |
| Minimum | 28.2% | 61.8% |
| Maximum | 100.0% | 100.0% |
| Range | 71.8% | 38.2% |
| Mean | 82.4% | 83.9% |
| Median | 85.1% | 85.0% |
| Interquartile 25% (IQ1) | 80.4% | 80.4% |
| Interquartile 75% (IQ3) | 93.1% | 86.8% |
| Interquartile Range (IQR) | 12.7% | 6.4% |
| Standard Deviation (Sample) | 17.8% | 7.3% |
| Standard Deviation (Population) | 17.6% | 7.2% |
Demographics Similar to Icelanders and Immigrants from Uzbekistan by In Labor Force | Age 35-44
In terms of in labor force | age 35-44, the demographic groups most similar to Icelanders are French (84.0%, a difference of 0.020%), Immigrants from Nicaragua (84.1%, a difference of 0.060%), Subsaharan African (84.1%, a difference of 0.060%), Immigrants from Norway (84.1%, a difference of 0.10%), and European (84.1%, a difference of 0.11%). Similarly, the demographic groups most similar to Immigrants from Uzbekistan are British (84.2%, a difference of 0.0%), Immigrants from South Eastern Asia (84.2%, a difference of 0.0%), Canadian (84.2%, a difference of 0.030%), Immigrants from Canada (84.2%, a difference of 0.030%), and Immigrants from Costa Rica (84.2%, a difference of 0.030%).
| Demographics | Rating | Rank | In Labor Force | Age 35-44 |
| British | 23.0 /100 | #201 | Fair 84.2% |
| Immigrants | Uzbekistan | 22.8 /100 | #202 | Fair 84.2% |
| Immigrants | South Eastern Asia | 22.4 /100 | #203 | Fair 84.2% |
| Canadians | 19.9 /100 | #204 | Poor 84.2% |
| Immigrants | Canada | 19.6 /100 | #205 | Poor 84.2% |
| Immigrants | Costa Rica | 19.5 /100 | #206 | Poor 84.2% |
| Laotians | 19.0 /100 | #207 | Poor 84.2% |
| Immigrants | North America | 18.1 /100 | #208 | Poor 84.2% |
| Swiss | 17.4 /100 | #209 | Poor 84.2% |
| New Zealanders | 16.2 /100 | #210 | Poor 84.1% |
| Immigrants | Ecuador | 15.2 /100 | #211 | Poor 84.1% |
| Israelis | 14.0 /100 | #212 | Poor 84.1% |
| Bangladeshis | 13.7 /100 | #213 | Poor 84.1% |
| Immigrants | Barbados | 13.2 /100 | #214 | Poor 84.1% |
| Europeans | 12.2 /100 | #215 | Poor 84.1% |
| Nicaraguans | 12.1 /100 | #216 | Poor 84.1% |
| Immigrants | Norway | 11.7 /100 | #217 | Poor 84.1% |
| Immigrants | Nicaragua | 9.4 /100 | #218 | Tragic 84.1% |
| Sub-Saharan Africans | 9.3 /100 | #219 | Tragic 84.1% |
| French | 7.5 /100 | #220 | Tragic 84.0% |
| Icelanders | 6.7 /100 | #221 | Tragic 84.0% |