Hungarian vs Egyptian In Labor Force | Age > 16
COMPARE
Hungarian
Egyptian
In Labor Force | Age > 16
In Labor Force | Age > 16 Comparison
Hungarians
Egyptians
63.8%
IN LABOR FORCE | AGE > 16
0.1/ 100
METRIC RATING
290th/ 347
METRIC RANK
66.2%
IN LABOR FORCE | AGE > 16
99.8/ 100
METRIC RATING
67th/ 347
METRIC RANK
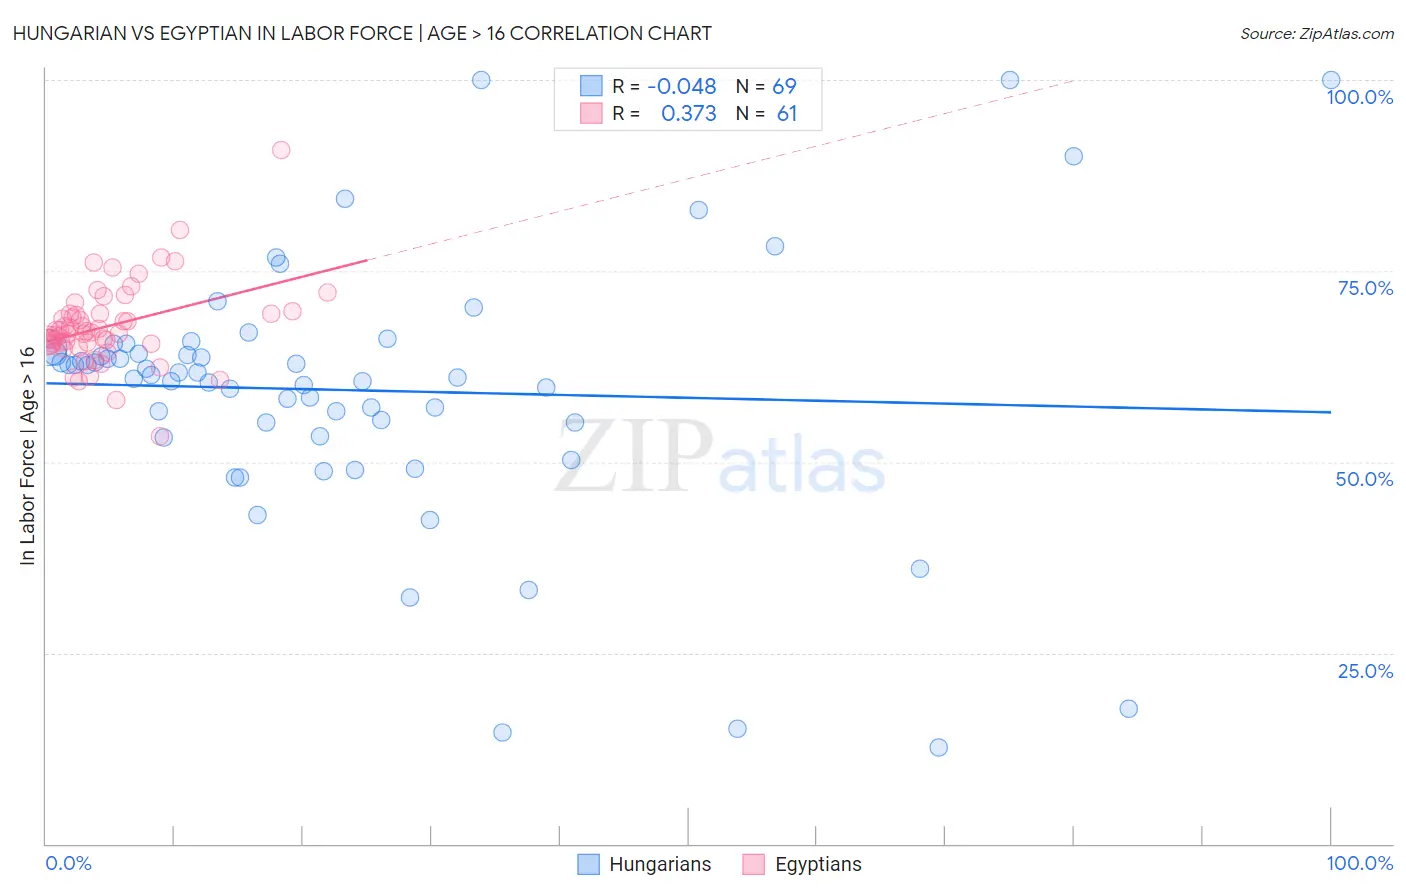
Hungarian vs Egyptian In Labor Force | Age > 16 Correlation Chart
The statistical analysis conducted on geographies consisting of 486,247,261 people shows no correlation between the proportion of Hungarians and labor force participation rate among population ages 16 and over in the United States with a correlation coefficient (R) of -0.048 and weighted average of 63.8%. Similarly, the statistical analysis conducted on geographies consisting of 276,931,154 people shows a mild positive correlation between the proportion of Egyptians and labor force participation rate among population ages 16 and over in the United States with a correlation coefficient (R) of 0.373 and weighted average of 66.2%, a difference of 3.8%.
In Labor Force | Age > 16 Correlation Summary
| Measurement | Hungarian | Egyptian |
| Minimum | 12.6% | 53.4% |
| Maximum | 100.0% | 90.9% |
| Range | 87.4% | 37.5% |
| Mean | 59.4% | 67.8% |
| Median | 61.3% | 66.9% |
| Interquartile 25% (IQ1) | 54.3% | 65.5% |
| Interquartile 75% (IQ3) | 64.6% | 69.4% |
| Interquartile Range (IQR) | 10.3% | 3.9% |
| Standard Deviation (Sample) | 17.2% | 5.5% |
| Standard Deviation (Population) | 17.0% | 5.5% |
Similar Demographics by In Labor Force | Age > 16
Demographics Similar to Hungarians by In Labor Force | Age > 16
In terms of in labor force | age > 16, the demographic groups most similar to Hungarians are Nepalese (63.8%, a difference of 0.010%), Celtic (63.8%, a difference of 0.030%), Spanish (63.9%, a difference of 0.060%), Spanish American Indian (63.8%, a difference of 0.070%), and Immigrants from Austria (63.9%, a difference of 0.10%).
| Demographics | Rating | Rank | In Labor Force | Age > 16 |
| Immigrants | Germany | 0.1 /100 | #283 | Tragic 63.9% |
| French | 0.1 /100 | #284 | Tragic 63.9% |
| Slovaks | 0.1 /100 | #285 | Tragic 63.9% |
| Immigrants | Austria | 0.1 /100 | #286 | Tragic 63.9% |
| Scottish | 0.1 /100 | #287 | Tragic 63.9% |
| Spanish | 0.1 /100 | #288 | Tragic 63.9% |
| Celtics | 0.1 /100 | #289 | Tragic 63.8% |
| Hungarians | 0.1 /100 | #290 | Tragic 63.8% |
| Nepalese | 0.1 /100 | #291 | Tragic 63.8% |
| Spanish American Indians | 0.1 /100 | #292 | Tragic 63.8% |
| English | 0.1 /100 | #293 | Tragic 63.7% |
| Puget Sound Salish | 0.0 /100 | #294 | Tragic 63.7% |
| Immigrants | Canada | 0.0 /100 | #295 | Tragic 63.7% |
| Immigrants | North America | 0.0 /100 | #296 | Tragic 63.7% |
| Immigrants | Grenada | 0.0 /100 | #297 | Tragic 63.6% |
Demographics Similar to Egyptians by In Labor Force | Age > 16
In terms of in labor force | age > 16, the demographic groups most similar to Egyptians are Jordanian (66.3%, a difference of 0.020%), Sri Lankan (66.3%, a difference of 0.050%), Immigrants from Egypt (66.2%, a difference of 0.050%), Subsaharan African (66.2%, a difference of 0.050%), and Venezuelan (66.3%, a difference of 0.060%).
| Demographics | Rating | Rank | In Labor Force | Age > 16 |
| Immigrants | Peru | 99.8 /100 | #60 | Exceptional 66.3% |
| Immigrants | Burma/Myanmar | 99.8 /100 | #61 | Exceptional 66.3% |
| Indonesians | 99.8 /100 | #62 | Exceptional 66.3% |
| Venezuelans | 99.8 /100 | #63 | Exceptional 66.3% |
| Peruvians | 99.8 /100 | #64 | Exceptional 66.3% |
| Sri Lankans | 99.8 /100 | #65 | Exceptional 66.3% |
| Jordanians | 99.8 /100 | #66 | Exceptional 66.3% |
| Egyptians | 99.8 /100 | #67 | Exceptional 66.2% |
| Immigrants | Egypt | 99.7 /100 | #68 | Exceptional 66.2% |
| Sub-Saharan Africans | 99.7 /100 | #69 | Exceptional 66.2% |
| Asians | 99.7 /100 | #70 | Exceptional 66.2% |
| Burmese | 99.7 /100 | #71 | Exceptional 66.2% |
| Taiwanese | 99.7 /100 | #72 | Exceptional 66.2% |
| Immigrants | Vietnam | 99.7 /100 | #73 | Exceptional 66.2% |
| Immigrants | Korea | 99.7 /100 | #74 | Exceptional 66.2% |