Honduran vs Navajo In Labor Force | Age 20-64
COMPARE
Honduran
Navajo
In Labor Force | Age 20-64
In Labor Force | Age 20-64 Comparison
Hondurans
Navajo
78.8%
IN LABOR FORCE | AGE 20-64
0.8/ 100
METRIC RATING
250th/ 347
METRIC RANK
69.2%
IN LABOR FORCE | AGE 20-64
0.0/ 100
METRIC RATING
346th/ 347
METRIC RANK
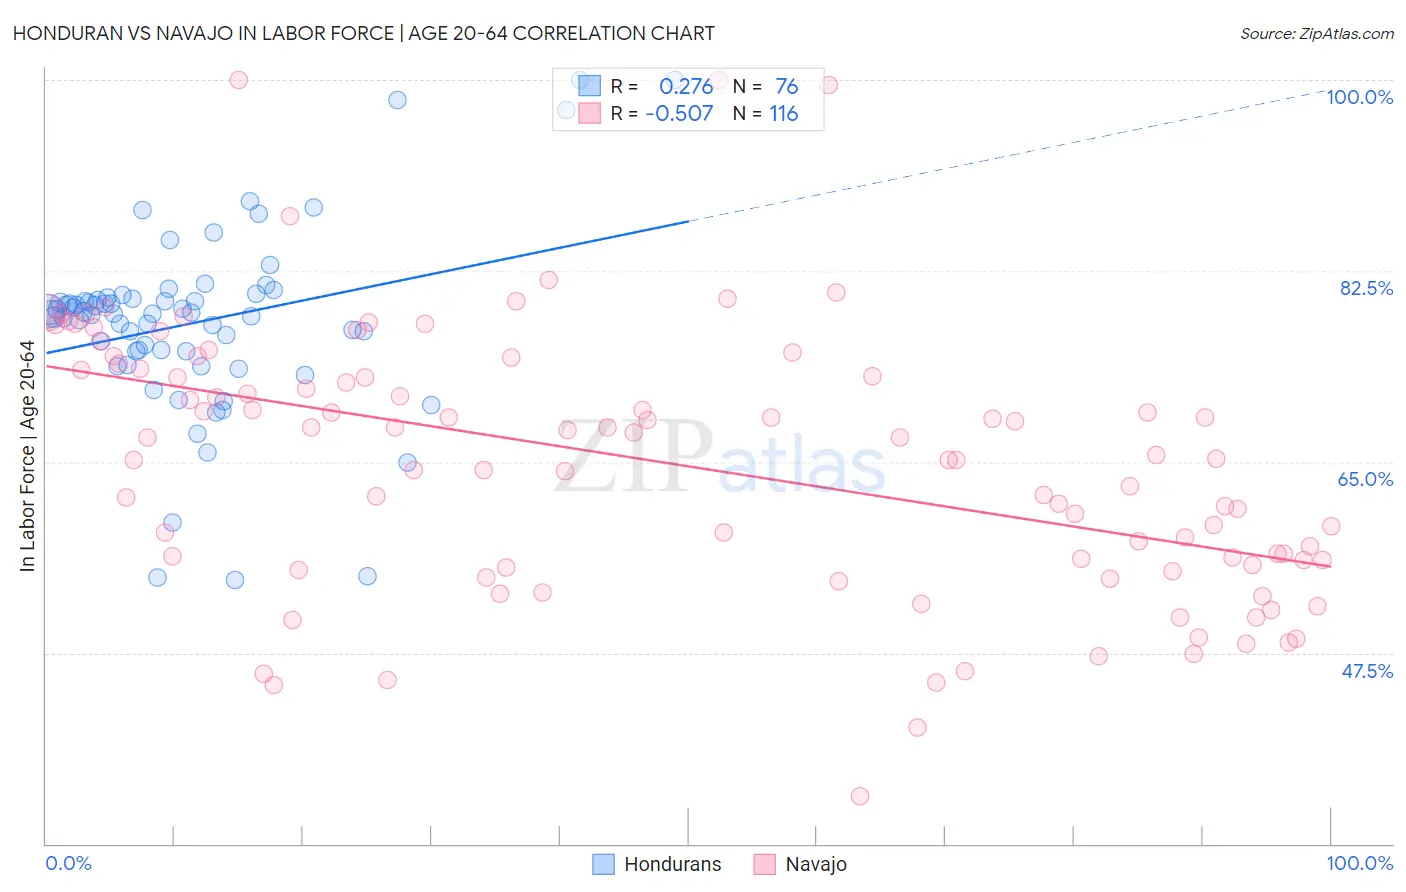
Honduran vs Navajo In Labor Force | Age 20-64 Correlation Chart
The statistical analysis conducted on geographies consisting of 357,847,494 people shows a weak positive correlation between the proportion of Hondurans and labor force participation rate among population between the ages 20 and 64 in the United States with a correlation coefficient (R) of 0.276 and weighted average of 78.8%. Similarly, the statistical analysis conducted on geographies consisting of 224,851,077 people shows a substantial negative correlation between the proportion of Navajo and labor force participation rate among population between the ages 20 and 64 in the United States with a correlation coefficient (R) of -0.507 and weighted average of 69.2%, a difference of 13.9%.
In Labor Force | Age 20-64 Correlation Summary
| Measurement | Honduran | Navajo |
| Minimum | 54.2% | 34.4% |
| Maximum | 100.0% | 100.0% |
| Range | 45.8% | 65.6% |
| Mean | 77.7% | 64.9% |
| Median | 78.6% | 65.5% |
| Interquartile 25% (IQ1) | 75.1% | 55.8% |
| Interquartile 75% (IQ3) | 79.9% | 73.5% |
| Interquartile Range (IQR) | 4.8% | 17.7% |
| Standard Deviation (Sample) | 8.4% | 12.3% |
| Standard Deviation (Population) | 8.4% | 12.2% |
Similar Demographics by In Labor Force | Age 20-64
Demographics Similar to Hondurans by In Labor Force | Age 20-64
In terms of in labor force | age 20-64, the demographic groups most similar to Hondurans are English (78.8%, a difference of 0.0%), Immigrants from Caribbean (78.8%, a difference of 0.030%), Barbadian (78.8%, a difference of 0.030%), Immigrants from Germany (78.8%, a difference of 0.040%), and Immigrants from Trinidad and Tobago (78.8%, a difference of 0.060%).
| Demographics | Rating | Rank | In Labor Force | Age 20-64 |
| Immigrants | West Indies | 1.7 /100 | #243 | Tragic 78.9% |
| French | 1.5 /100 | #244 | Tragic 78.9% |
| Scottish | 1.3 /100 | #245 | Tragic 78.9% |
| Immigrants | Trinidad and Tobago | 1.1 /100 | #246 | Tragic 78.8% |
| Immigrants | Germany | 1.0 /100 | #247 | Tragic 78.8% |
| Immigrants | Caribbean | 1.0 /100 | #248 | Tragic 78.8% |
| English | 0.9 /100 | #249 | Tragic 78.8% |
| Hondurans | 0.8 /100 | #250 | Tragic 78.8% |
| Barbadians | 0.7 /100 | #251 | Tragic 78.8% |
| Immigrants | Honduras | 0.6 /100 | #252 | Tragic 78.7% |
| Basques | 0.5 /100 | #253 | Tragic 78.7% |
| Immigrants | Lebanon | 0.5 /100 | #254 | Tragic 78.7% |
| Hawaiians | 0.5 /100 | #255 | Tragic 78.7% |
| Celtics | 0.5 /100 | #256 | Tragic 78.7% |
| Guatemalans | 0.4 /100 | #257 | Tragic 78.7% |
Demographics Similar to Navajo by In Labor Force | Age 20-64
In terms of in labor force | age 20-64, the demographic groups most similar to Navajo are Pima (69.0%, a difference of 0.16%), Tohono O'odham (70.4%, a difference of 1.8%), Lumbee (70.6%, a difference of 2.1%), Hopi (71.7%, a difference of 3.7%), and Yuman (71.7%, a difference of 3.7%).
| Demographics | Rating | Rank | In Labor Force | Age 20-64 |
| Natives/Alaskans | 0.0 /100 | #333 | Tragic 73.9% |
| Apache | 0.0 /100 | #334 | Tragic 73.7% |
| Ute | 0.0 /100 | #335 | Tragic 73.7% |
| Crow | 0.0 /100 | #336 | Tragic 73.3% |
| Yup'ik | 0.0 /100 | #337 | Tragic 73.2% |
| Puerto Ricans | 0.0 /100 | #338 | Tragic 73.1% |
| Houma | 0.0 /100 | #339 | Tragic 72.7% |
| Pueblo | 0.0 /100 | #340 | Tragic 72.6% |
| Immigrants | Yemen | 0.0 /100 | #341 | Tragic 72.3% |
| Yuman | 0.0 /100 | #342 | Tragic 71.7% |
| Hopi | 0.0 /100 | #343 | Tragic 71.7% |
| Lumbee | 0.0 /100 | #344 | Tragic 70.6% |
| Tohono O'odham | 0.0 /100 | #345 | Tragic 70.4% |
| Navajo | 0.0 /100 | #346 | Tragic 69.2% |
| Pima | 0.0 /100 | #347 | Tragic 69.0% |