Honduran vs Navajo Births to Unmarried Women
COMPARE
Honduran
Navajo
Births to Unmarried Women
Births to Unmarried Women Comparison
Hondurans
Navajo
38.7%
BIRTHS TO UNMARRIED WOMEN
0.0/ 100
METRIC RATING
302nd/ 347
METRIC RANK
51.5%
BIRTHS TO UNMARRIED WOMEN
0.0/ 100
METRIC RATING
344th/ 347
METRIC RANK
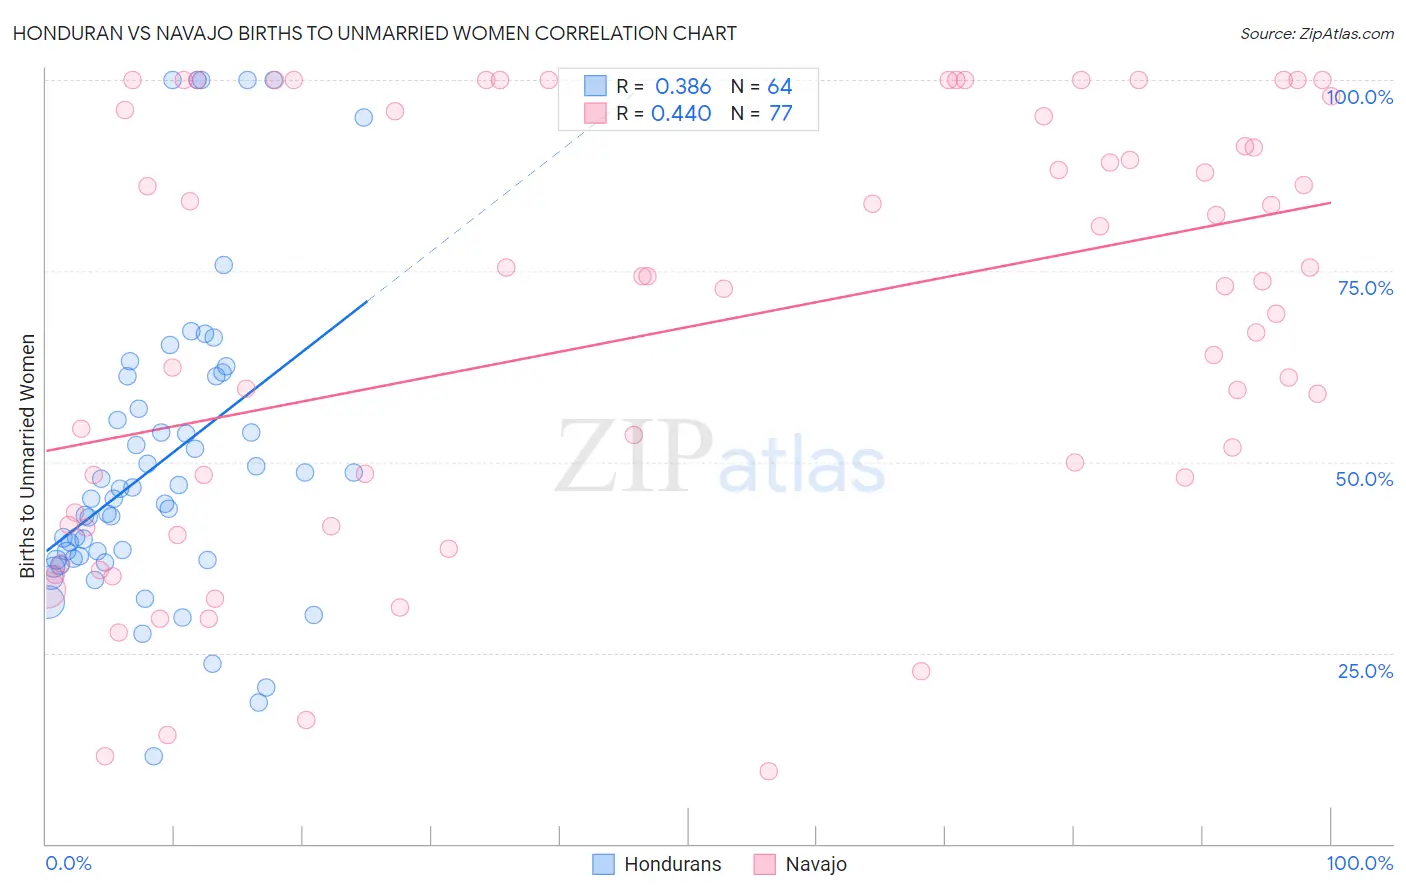
Honduran vs Navajo Births to Unmarried Women Correlation Chart
The statistical analysis conducted on geographies consisting of 342,571,212 people shows a mild positive correlation between the proportion of Hondurans and percentage of births to unmarried women in the United States with a correlation coefficient (R) of 0.386 and weighted average of 38.7%. Similarly, the statistical analysis conducted on geographies consisting of 217,645,361 people shows a moderate positive correlation between the proportion of Navajo and percentage of births to unmarried women in the United States with a correlation coefficient (R) of 0.440 and weighted average of 51.5%, a difference of 33.2%.
Births to Unmarried Women Correlation Summary
| Measurement | Honduran | Navajo |
| Minimum | 11.5% | 9.5% |
| Maximum | 100.0% | 100.0% |
| Range | 88.5% | 90.5% |
| Mean | 49.8% | 67.3% |
| Median | 45.2% | 72.9% |
| Interquartile 25% (IQ1) | 37.3% | 41.6% |
| Interquartile 75% (IQ3) | 59.0% | 95.6% |
| Interquartile Range (IQR) | 21.8% | 54.0% |
| Standard Deviation (Sample) | 20.3% | 27.7% |
| Standard Deviation (Population) | 20.1% | 27.6% |
Similar Demographics by Births to Unmarried Women
Demographics Similar to Hondurans by Births to Unmarried Women
In terms of births to unmarried women, the demographic groups most similar to Hondurans are Haitian (38.6%, a difference of 0.24%), Immigrants from West Indies (38.6%, a difference of 0.25%), Spanish American (38.6%, a difference of 0.31%), Immigrants from Jamaica (38.8%, a difference of 0.32%), and Yaqui (38.8%, a difference of 0.37%).
| Demographics | Rating | Rank | Births to Unmarried Women |
| Iroquois | 0.0 /100 | #295 | Tragic 38.2% |
| Alaska Natives | 0.0 /100 | #296 | Tragic 38.3% |
| Dutch West Indians | 0.0 /100 | #297 | Tragic 38.4% |
| Jamaicans | 0.0 /100 | #298 | Tragic 38.5% |
| Spanish Americans | 0.0 /100 | #299 | Tragic 38.6% |
| Immigrants | West Indies | 0.0 /100 | #300 | Tragic 38.6% |
| Haitians | 0.0 /100 | #301 | Tragic 38.6% |
| Hondurans | 0.0 /100 | #302 | Tragic 38.7% |
| Immigrants | Jamaica | 0.0 /100 | #303 | Tragic 38.8% |
| Yaqui | 0.0 /100 | #304 | Tragic 38.8% |
| Immigrants | Haiti | 0.0 /100 | #305 | Tragic 38.9% |
| Central American Indians | 0.0 /100 | #306 | Tragic 39.0% |
| Immigrants | Honduras | 0.0 /100 | #307 | Tragic 39.3% |
| Aleuts | 0.0 /100 | #308 | Tragic 39.3% |
| Cubans | 0.0 /100 | #309 | Tragic 39.4% |
Demographics Similar to Navajo by Births to Unmarried Women
In terms of births to unmarried women, the demographic groups most similar to Navajo are Pima (51.5%, a difference of 0.040%), Menominee (51.1%, a difference of 0.74%), Inupiat (52.1%, a difference of 1.2%), Hopi (50.8%, a difference of 1.3%), and Tohono O'odham (49.8%, a difference of 3.3%).
| Demographics | Rating | Rank | Births to Unmarried Women |
| Blacks/African Americans | 0.0 /100 | #333 | Tragic 44.3% |
| Yuman | 0.0 /100 | #334 | Tragic 44.4% |
| Colville | 0.0 /100 | #335 | Tragic 45.3% |
| Puerto Ricans | 0.0 /100 | #336 | Tragic 45.7% |
| Houma | 0.0 /100 | #337 | Tragic 46.6% |
| Arapaho | 0.0 /100 | #338 | Tragic 47.1% |
| Lumbee | 0.0 /100 | #339 | Tragic 48.2% |
| Tohono O'odham | 0.0 /100 | #340 | Tragic 49.8% |
| Hopi | 0.0 /100 | #341 | Tragic 50.8% |
| Menominee | 0.0 /100 | #342 | Tragic 51.1% |
| Pima | 0.0 /100 | #343 | Tragic 51.5% |
| Navajo | 0.0 /100 | #344 | Tragic 51.5% |
| Inupiat | 0.0 /100 | #345 | Tragic 52.1% |
| Pueblo | 0.0 /100 | #346 | Tragic 53.7% |
| Yup'ik | 0.0 /100 | #347 | Tragic 56.4% |