Tongan vs Navajo In Labor Force | Age 20-64
COMPARE
Tongan
Navajo
In Labor Force | Age 20-64
In Labor Force | Age 20-64 Comparison
Tongans
Navajo
80.3%
IN LABOR FORCE | AGE 20-64
98.8/ 100
METRIC RATING
60th/ 347
METRIC RANK
69.2%
IN LABOR FORCE | AGE 20-64
0.0/ 100
METRIC RATING
346th/ 347
METRIC RANK
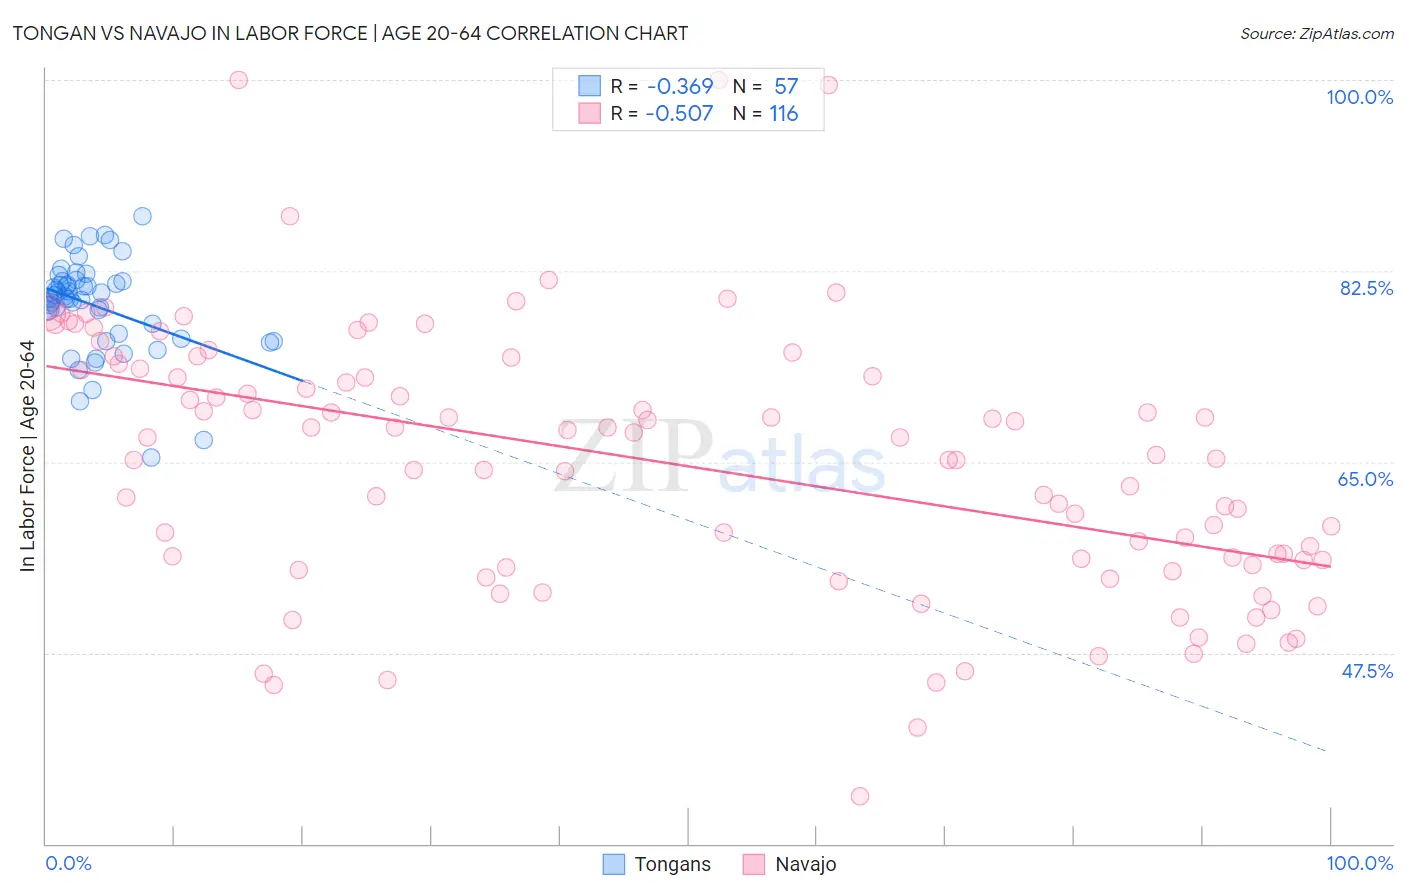
Tongan vs Navajo In Labor Force | Age 20-64 Correlation Chart
The statistical analysis conducted on geographies consisting of 102,905,644 people shows a mild negative correlation between the proportion of Tongans and labor force participation rate among population between the ages 20 and 64 in the United States with a correlation coefficient (R) of -0.369 and weighted average of 80.3%. Similarly, the statistical analysis conducted on geographies consisting of 224,851,077 people shows a substantial negative correlation between the proportion of Navajo and labor force participation rate among population between the ages 20 and 64 in the United States with a correlation coefficient (R) of -0.507 and weighted average of 69.2%, a difference of 16.1%.
In Labor Force | Age 20-64 Correlation Summary
| Measurement | Tongan | Navajo |
| Minimum | 65.4% | 34.4% |
| Maximum | 87.5% | 100.0% |
| Range | 22.1% | 65.6% |
| Mean | 79.3% | 64.9% |
| Median | 80.0% | 65.5% |
| Interquartile 25% (IQ1) | 76.5% | 55.8% |
| Interquartile 75% (IQ3) | 81.6% | 73.5% |
| Interquartile Range (IQR) | 5.0% | 17.7% |
| Standard Deviation (Sample) | 4.4% | 12.3% |
| Standard Deviation (Population) | 4.3% | 12.2% |
Similar Demographics by In Labor Force | Age 20-64
Demographics Similar to Tongans by In Labor Force | Age 20-64
In terms of in labor force | age 20-64, the demographic groups most similar to Tongans are Swedish (80.3%, a difference of 0.0%), Burmese (80.3%, a difference of 0.0%), Carpatho Rusyn (80.3%, a difference of 0.0%), Serbian (80.3%, a difference of 0.010%), and Immigrants from Korea (80.3%, a difference of 0.010%).
| Demographics | Rating | Rank | In Labor Force | Age 20-64 |
| Immigrants | Peru | 99.2 /100 | #53 | Exceptional 80.3% |
| Peruvians | 99.1 /100 | #54 | Exceptional 80.3% |
| Immigrants | Cabo Verde | 99.0 /100 | #55 | Exceptional 80.3% |
| Immigrants | Northern Africa | 99.0 /100 | #56 | Exceptional 80.3% |
| Afghans | 98.9 /100 | #57 | Exceptional 80.3% |
| Serbians | 98.9 /100 | #58 | Exceptional 80.3% |
| Swedes | 98.9 /100 | #59 | Exceptional 80.3% |
| Tongans | 98.8 /100 | #60 | Exceptional 80.3% |
| Burmese | 98.8 /100 | #61 | Exceptional 80.3% |
| Carpatho Rusyns | 98.8 /100 | #62 | Exceptional 80.3% |
| Immigrants | Korea | 98.8 /100 | #63 | Exceptional 80.3% |
| Immigrants | Albania | 98.7 /100 | #64 | Exceptional 80.3% |
| Lithuanians | 98.7 /100 | #65 | Exceptional 80.2% |
| Macedonians | 98.7 /100 | #66 | Exceptional 80.2% |
| Taiwanese | 98.6 /100 | #67 | Exceptional 80.2% |
Demographics Similar to Navajo by In Labor Force | Age 20-64
In terms of in labor force | age 20-64, the demographic groups most similar to Navajo are Pima (69.0%, a difference of 0.16%), Tohono O'odham (70.4%, a difference of 1.8%), Lumbee (70.6%, a difference of 2.1%), Hopi (71.7%, a difference of 3.7%), and Yuman (71.7%, a difference of 3.7%).
| Demographics | Rating | Rank | In Labor Force | Age 20-64 |
| Natives/Alaskans | 0.0 /100 | #333 | Tragic 73.9% |
| Apache | 0.0 /100 | #334 | Tragic 73.7% |
| Ute | 0.0 /100 | #335 | Tragic 73.7% |
| Crow | 0.0 /100 | #336 | Tragic 73.3% |
| Yup'ik | 0.0 /100 | #337 | Tragic 73.2% |
| Puerto Ricans | 0.0 /100 | #338 | Tragic 73.1% |
| Houma | 0.0 /100 | #339 | Tragic 72.7% |
| Pueblo | 0.0 /100 | #340 | Tragic 72.6% |
| Immigrants | Yemen | 0.0 /100 | #341 | Tragic 72.3% |
| Yuman | 0.0 /100 | #342 | Tragic 71.7% |
| Hopi | 0.0 /100 | #343 | Tragic 71.7% |
| Lumbee | 0.0 /100 | #344 | Tragic 70.6% |
| Tohono O'odham | 0.0 /100 | #345 | Tragic 70.4% |
| Navajo | 0.0 /100 | #346 | Tragic 69.2% |
| Pima | 0.0 /100 | #347 | Tragic 69.0% |