Honduran vs Navajo Male Unemployment
COMPARE
Honduran
Navajo
Male Unemployment
Male Unemployment Comparison
Hondurans
Navajo
5.6%
MALE UNEMPLOYMENT
1.1/ 100
METRIC RATING
237th/ 347
METRIC RANK
9.8%
MALE UNEMPLOYMENT
0.0/ 100
METRIC RATING
341st/ 347
METRIC RANK
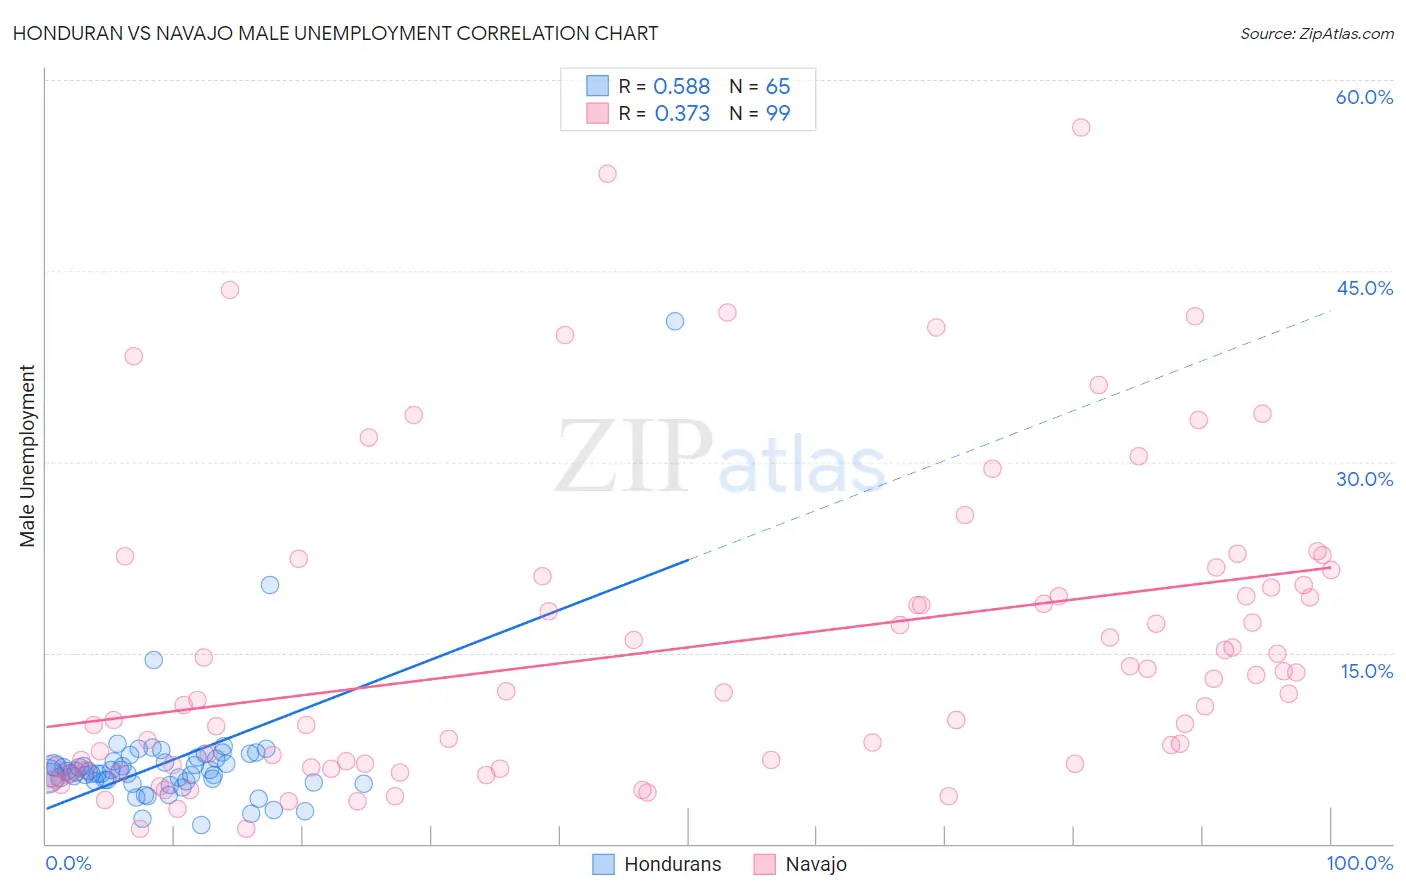
Honduran vs Navajo Male Unemployment Correlation Chart
The statistical analysis conducted on geographies consisting of 356,702,099 people shows a substantial positive correlation between the proportion of Hondurans and unemployment rate among males in the United States with a correlation coefficient (R) of 0.588 and weighted average of 5.6%. Similarly, the statistical analysis conducted on geographies consisting of 223,979,709 people shows a mild positive correlation between the proportion of Navajo and unemployment rate among males in the United States with a correlation coefficient (R) of 0.373 and weighted average of 9.8%, a difference of 74.3%.
Male Unemployment Correlation Summary
| Measurement | Honduran | Navajo |
| Minimum | 1.5% | 1.2% |
| Maximum | 41.0% | 56.3% |
| Range | 39.5% | 55.1% |
| Mean | 6.4% | 15.4% |
| Median | 5.5% | 11.9% |
| Interquartile 25% (IQ1) | 5.0% | 6.0% |
| Interquartile 75% (IQ3) | 6.6% | 20.4% |
| Interquartile Range (IQR) | 1.6% | 14.4% |
| Standard Deviation (Sample) | 5.0% | 12.0% |
| Standard Deviation (Population) | 5.0% | 11.9% |
Similar Demographics by Male Unemployment
Demographics Similar to Hondurans by Male Unemployment
In terms of male unemployment, the demographic groups most similar to Hondurans are Native Hawaiian (5.6%, a difference of 0.050%), Immigrants from Guatemala (5.6%, a difference of 0.050%), Guatemalan (5.6%, a difference of 0.090%), Immigrants from Cameroon (5.6%, a difference of 0.12%), and Salvadoran (5.7%, a difference of 0.16%).
| Demographics | Rating | Rank | Male Unemployment |
| Immigrants | Africa | 1.7 /100 | #230 | Tragic 5.6% |
| Choctaw | 1.6 /100 | #231 | Tragic 5.6% |
| Moroccans | 1.6 /100 | #232 | Tragic 5.6% |
| Somalis | 1.5 /100 | #233 | Tragic 5.6% |
| Immigrants | Somalia | 1.5 /100 | #234 | Tragic 5.6% |
| Immigrants | Honduras | 1.5 /100 | #235 | Tragic 5.6% |
| Guatemalans | 1.2 /100 | #236 | Tragic 5.6% |
| Hondurans | 1.1 /100 | #237 | Tragic 5.6% |
| Native Hawaiians | 1.1 /100 | #238 | Tragic 5.6% |
| Immigrants | Guatemala | 1.1 /100 | #239 | Tragic 5.6% |
| Immigrants | Cameroon | 1.0 /100 | #240 | Tragic 5.6% |
| Salvadorans | 1.0 /100 | #241 | Tragic 5.7% |
| Ottawa | 0.9 /100 | #242 | Tragic 5.7% |
| Bangladeshis | 0.8 /100 | #243 | Tragic 5.7% |
| Immigrants | El Salvador | 0.7 /100 | #244 | Tragic 5.7% |
Demographics Similar to Navajo by Male Unemployment
In terms of male unemployment, the demographic groups most similar to Navajo are Alaskan Athabascan (9.8%, a difference of 0.28%), Cheyenne (9.8%, a difference of 0.36%), Tohono O'odham (10.2%, a difference of 3.4%), Crow (10.6%, a difference of 7.9%), and Hopi (10.8%, a difference of 9.7%).
| Demographics | Rating | Rank | Male Unemployment |
| Sioux | 0.0 /100 | #333 | Tragic 8.4% |
| Tsimshian | 0.0 /100 | #334 | Tragic 8.5% |
| Pueblo | 0.0 /100 | #335 | Tragic 8.5% |
| Yuman | 0.0 /100 | #336 | Tragic 8.6% |
| Puerto Ricans | 0.0 /100 | #337 | Tragic 8.6% |
| Apache | 0.0 /100 | #338 | Tragic 8.6% |
| Cheyenne | 0.0 /100 | #339 | Tragic 9.8% |
| Alaskan Athabascans | 0.0 /100 | #340 | Tragic 9.8% |
| Navajo | 0.0 /100 | #341 | Tragic 9.8% |
| Tohono O'odham | 0.0 /100 | #342 | Tragic 10.2% |
| Crow | 0.0 /100 | #343 | Tragic 10.6% |
| Hopi | 0.0 /100 | #344 | Tragic 10.8% |
| Arapaho | 0.0 /100 | #345 | Tragic 11.0% |
| Inupiat | 0.0 /100 | #346 | Tragic 12.1% |
| Yup'ik | 0.0 /100 | #347 | Tragic 16.4% |