Chippewa vs Navajo In Labor Force | Age 20-64
COMPARE
Chippewa
Navajo
In Labor Force | Age 20-64
In Labor Force | Age 20-64 Comparison
Chippewa
Navajo
77.3%
IN LABOR FORCE | AGE 20-64
0.0/ 100
METRIC RATING
303rd/ 347
METRIC RANK
69.2%
IN LABOR FORCE | AGE 20-64
0.0/ 100
METRIC RATING
346th/ 347
METRIC RANK
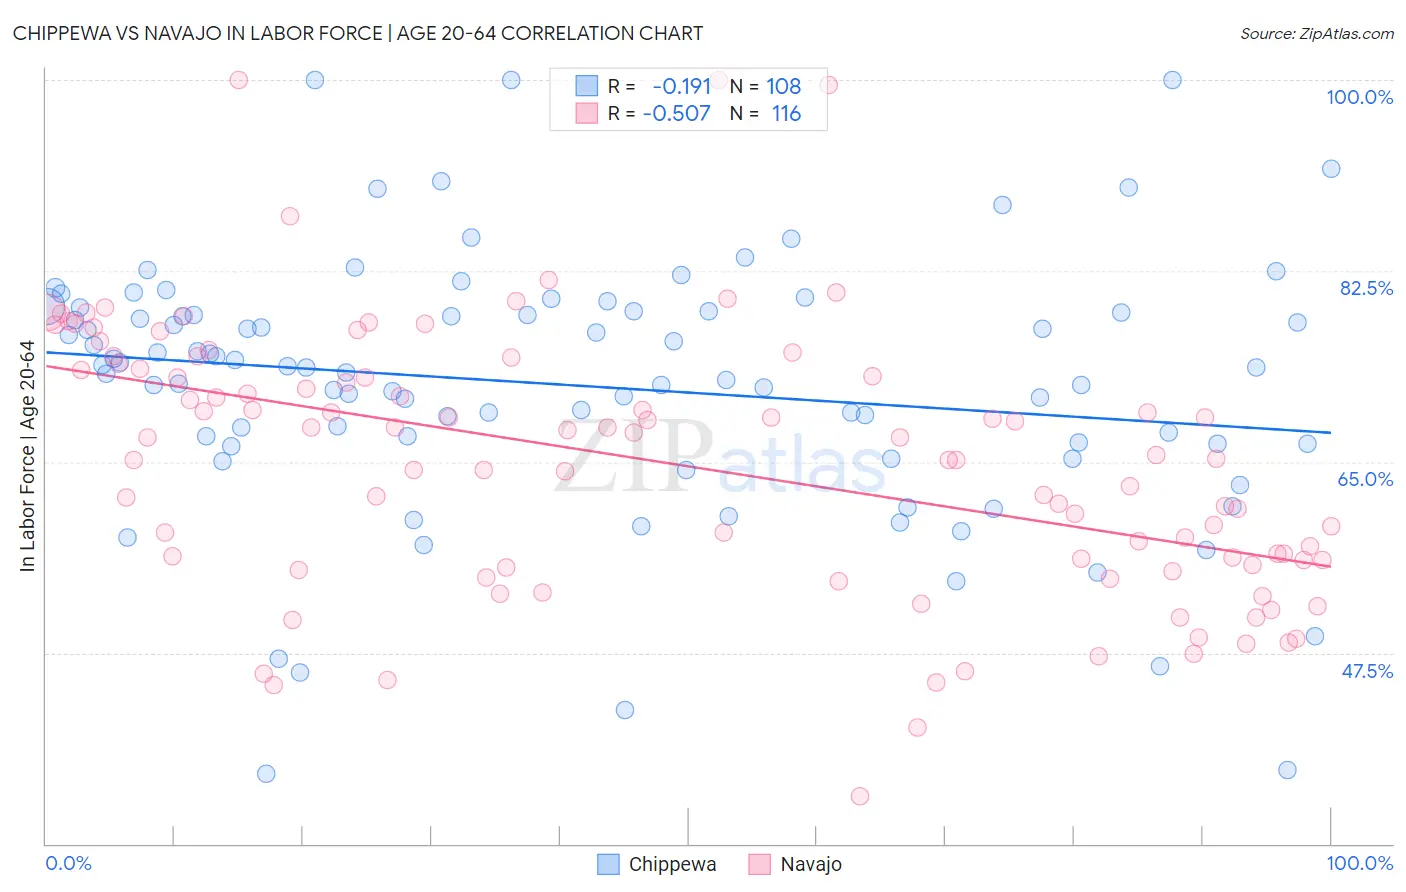
Chippewa vs Navajo In Labor Force | Age 20-64 Correlation Chart
The statistical analysis conducted on geographies consisting of 215,053,838 people shows a poor negative correlation between the proportion of Chippewa and labor force participation rate among population between the ages 20 and 64 in the United States with a correlation coefficient (R) of -0.191 and weighted average of 77.3%. Similarly, the statistical analysis conducted on geographies consisting of 224,851,077 people shows a substantial negative correlation between the proportion of Navajo and labor force participation rate among population between the ages 20 and 64 in the United States with a correlation coefficient (R) of -0.507 and weighted average of 69.2%, a difference of 11.8%.
In Labor Force | Age 20-64 Correlation Summary
| Measurement | Chippewa | Navajo |
| Minimum | 36.4% | 34.4% |
| Maximum | 100.0% | 100.0% |
| Range | 63.6% | 65.6% |
| Mean | 72.0% | 64.9% |
| Median | 73.6% | 65.5% |
| Interquartile 25% (IQ1) | 66.7% | 55.8% |
| Interquartile 75% (IQ3) | 78.7% | 73.5% |
| Interquartile Range (IQR) | 12.0% | 17.7% |
| Standard Deviation (Sample) | 11.9% | 12.3% |
| Standard Deviation (Population) | 11.9% | 12.2% |
Similar Demographics by In Labor Force | Age 20-64
Demographics Similar to Chippewa by In Labor Force | Age 20-64
In terms of in labor force | age 20-64, the demographic groups most similar to Chippewa are Immigrants from Mexico (77.3%, a difference of 0.070%), Mexican (77.2%, a difference of 0.11%), Potawatomi (77.2%, a difference of 0.12%), Iroquois (77.5%, a difference of 0.22%), and Nepalese (77.5%, a difference of 0.27%).
| Demographics | Rating | Rank | In Labor Force | Age 20-64 |
| Immigrants | Dominican Republic | 0.0 /100 | #296 | Tragic 77.7% |
| Dominicans | 0.0 /100 | #297 | Tragic 77.7% |
| Cree | 0.0 /100 | #298 | Tragic 77.7% |
| Hispanics or Latinos | 0.0 /100 | #299 | Tragic 77.6% |
| Spanish American Indians | 0.0 /100 | #300 | Tragic 77.6% |
| Nepalese | 0.0 /100 | #301 | Tragic 77.5% |
| Iroquois | 0.0 /100 | #302 | Tragic 77.5% |
| Chippewa | 0.0 /100 | #303 | Tragic 77.3% |
| Immigrants | Mexico | 0.0 /100 | #304 | Tragic 77.3% |
| Mexicans | 0.0 /100 | #305 | Tragic 77.2% |
| Potawatomi | 0.0 /100 | #306 | Tragic 77.2% |
| Central American Indians | 0.0 /100 | #307 | Tragic 77.1% |
| Alaska Natives | 0.0 /100 | #308 | Tragic 77.0% |
| Americans | 0.0 /100 | #309 | Tragic 77.0% |
| Comanche | 0.0 /100 | #310 | Tragic 77.0% |
Demographics Similar to Navajo by In Labor Force | Age 20-64
In terms of in labor force | age 20-64, the demographic groups most similar to Navajo are Pima (69.0%, a difference of 0.16%), Tohono O'odham (70.4%, a difference of 1.8%), Lumbee (70.6%, a difference of 2.1%), Hopi (71.7%, a difference of 3.7%), and Yuman (71.7%, a difference of 3.7%).
| Demographics | Rating | Rank | In Labor Force | Age 20-64 |
| Natives/Alaskans | 0.0 /100 | #333 | Tragic 73.9% |
| Apache | 0.0 /100 | #334 | Tragic 73.7% |
| Ute | 0.0 /100 | #335 | Tragic 73.7% |
| Crow | 0.0 /100 | #336 | Tragic 73.3% |
| Yup'ik | 0.0 /100 | #337 | Tragic 73.2% |
| Puerto Ricans | 0.0 /100 | #338 | Tragic 73.1% |
| Houma | 0.0 /100 | #339 | Tragic 72.7% |
| Pueblo | 0.0 /100 | #340 | Tragic 72.6% |
| Immigrants | Yemen | 0.0 /100 | #341 | Tragic 72.3% |
| Yuman | 0.0 /100 | #342 | Tragic 71.7% |
| Hopi | 0.0 /100 | #343 | Tragic 71.7% |
| Lumbee | 0.0 /100 | #344 | Tragic 70.6% |
| Tohono O'odham | 0.0 /100 | #345 | Tragic 70.4% |
| Navajo | 0.0 /100 | #346 | Tragic 69.2% |
| Pima | 0.0 /100 | #347 | Tragic 69.0% |