Honduran vs Finnish In Labor Force | Age 20-64
COMPARE
Honduran
Finnish
In Labor Force | Age 20-64
In Labor Force | Age 20-64 Comparison
Hondurans
Finns
78.8%
IN LABOR FORCE | AGE 20-64
0.8/ 100
METRIC RATING
250th/ 347
METRIC RANK
79.5%
IN LABOR FORCE | AGE 20-64
35.9/ 100
METRIC RATING
184th/ 347
METRIC RANK
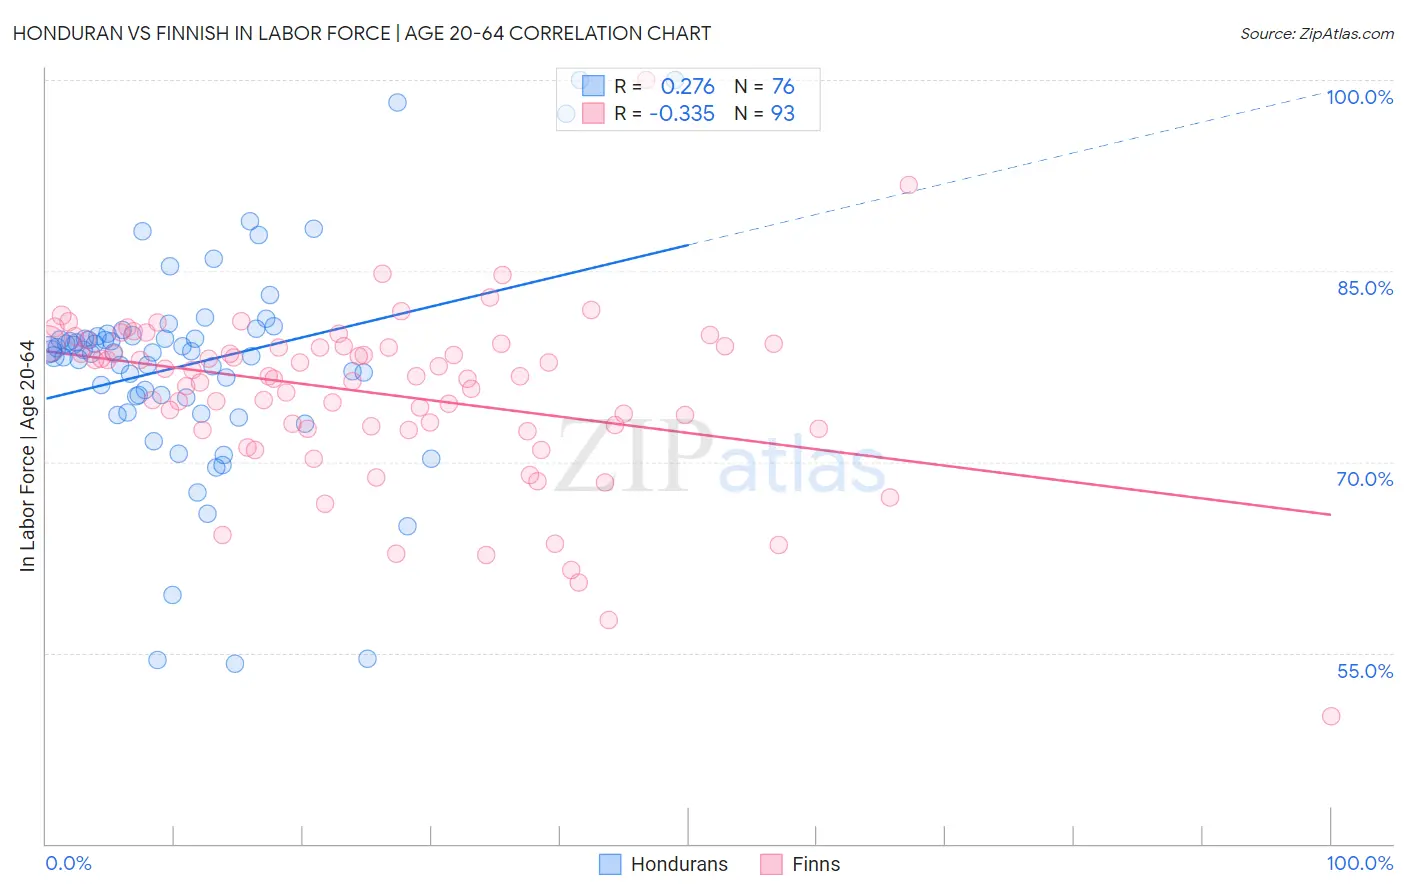
Honduran vs Finnish In Labor Force | Age 20-64 Correlation Chart
The statistical analysis conducted on geographies consisting of 357,847,494 people shows a weak positive correlation between the proportion of Hondurans and labor force participation rate among population between the ages 20 and 64 in the United States with a correlation coefficient (R) of 0.276 and weighted average of 78.8%. Similarly, the statistical analysis conducted on geographies consisting of 404,683,830 people shows a mild negative correlation between the proportion of Finns and labor force participation rate among population between the ages 20 and 64 in the United States with a correlation coefficient (R) of -0.335 and weighted average of 79.5%, a difference of 0.85%.
In Labor Force | Age 20-64 Correlation Summary
| Measurement | Honduran | Finnish |
| Minimum | 54.2% | 50.0% |
| Maximum | 100.0% | 100.0% |
| Range | 45.8% | 50.0% |
| Mean | 77.7% | 75.4% |
| Median | 78.6% | 76.7% |
| Interquartile 25% (IQ1) | 75.1% | 72.6% |
| Interquartile 75% (IQ3) | 79.9% | 79.2% |
| Interquartile Range (IQR) | 4.8% | 6.5% |
| Standard Deviation (Sample) | 8.4% | 6.9% |
| Standard Deviation (Population) | 8.4% | 6.8% |
Similar Demographics by In Labor Force | Age 20-64
Demographics Similar to Hondurans by In Labor Force | Age 20-64
In terms of in labor force | age 20-64, the demographic groups most similar to Hondurans are English (78.8%, a difference of 0.0%), Immigrants from Caribbean (78.8%, a difference of 0.030%), Barbadian (78.8%, a difference of 0.030%), Immigrants from Germany (78.8%, a difference of 0.040%), and Immigrants from Trinidad and Tobago (78.8%, a difference of 0.060%).
| Demographics | Rating | Rank | In Labor Force | Age 20-64 |
| Immigrants | West Indies | 1.7 /100 | #243 | Tragic 78.9% |
| French | 1.5 /100 | #244 | Tragic 78.9% |
| Scottish | 1.3 /100 | #245 | Tragic 78.9% |
| Immigrants | Trinidad and Tobago | 1.1 /100 | #246 | Tragic 78.8% |
| Immigrants | Germany | 1.0 /100 | #247 | Tragic 78.8% |
| Immigrants | Caribbean | 1.0 /100 | #248 | Tragic 78.8% |
| English | 0.9 /100 | #249 | Tragic 78.8% |
| Hondurans | 0.8 /100 | #250 | Tragic 78.8% |
| Barbadians | 0.7 /100 | #251 | Tragic 78.8% |
| Immigrants | Honduras | 0.6 /100 | #252 | Tragic 78.7% |
| Basques | 0.5 /100 | #253 | Tragic 78.7% |
| Immigrants | Lebanon | 0.5 /100 | #254 | Tragic 78.7% |
| Hawaiians | 0.5 /100 | #255 | Tragic 78.7% |
| Celtics | 0.5 /100 | #256 | Tragic 78.7% |
| Guatemalans | 0.4 /100 | #257 | Tragic 78.7% |
Demographics Similar to Finns by In Labor Force | Age 20-64
In terms of in labor force | age 20-64, the demographic groups most similar to Finns are Malaysian (79.5%, a difference of 0.010%), Immigrants from Hungary (79.5%, a difference of 0.010%), Israeli (79.5%, a difference of 0.010%), Northern European (79.5%, a difference of 0.010%), and Immigrants from Saudi Arabia (79.5%, a difference of 0.020%).
| Demographics | Rating | Rank | In Labor Force | Age 20-64 |
| Immigrants | Netherlands | 45.2 /100 | #177 | Average 79.5% |
| Czechoslovakians | 44.3 /100 | #178 | Average 79.5% |
| Armenians | 41.4 /100 | #179 | Average 79.5% |
| Salvadorans | 41.0 /100 | #180 | Average 79.5% |
| Immigrants | Saudi Arabia | 37.7 /100 | #181 | Fair 79.5% |
| Malaysians | 37.1 /100 | #182 | Fair 79.5% |
| Immigrants | Hungary | 36.8 /100 | #183 | Fair 79.5% |
| Finns | 35.9 /100 | #184 | Fair 79.5% |
| Israelis | 34.7 /100 | #185 | Fair 79.5% |
| Northern Europeans | 34.5 /100 | #186 | Fair 79.5% |
| Assyrians/Chaldeans/Syriacs | 33.3 /100 | #187 | Fair 79.4% |
| Immigrants | Haiti | 32.1 /100 | #188 | Fair 79.4% |
| Immigrants | El Salvador | 30.9 /100 | #189 | Fair 79.4% |
| Immigrants | Syria | 30.8 /100 | #190 | Fair 79.4% |
| Swiss | 28.9 /100 | #191 | Fair 79.4% |