Honduran vs Navajo Median Female Earnings
COMPARE
Honduran
Navajo
Median Female Earnings
Median Female Earnings Comparison
Hondurans
Navajo
$35,013
MEDIAN FEMALE EARNINGS
0.0/ 100
METRIC RATING
309th/ 347
METRIC RANK
$33,046
MEDIAN FEMALE EARNINGS
0.0/ 100
METRIC RATING
341st/ 347
METRIC RANK
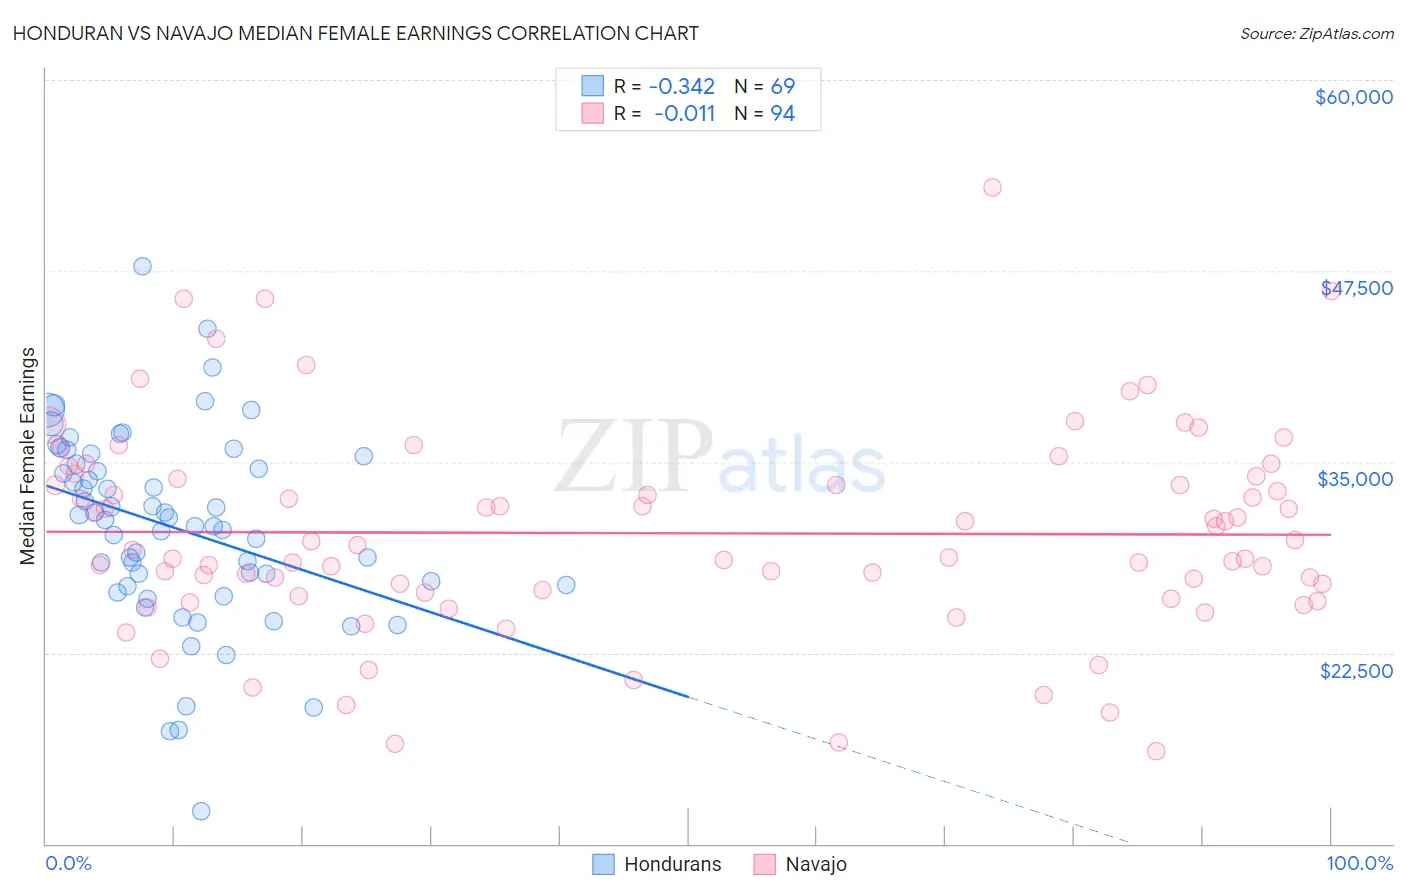
Honduran vs Navajo Median Female Earnings Correlation Chart
The statistical analysis conducted on geographies consisting of 357,702,253 people shows a mild negative correlation between the proportion of Hondurans and median female earnings in the United States with a correlation coefficient (R) of -0.342 and weighted average of $35,013. Similarly, the statistical analysis conducted on geographies consisting of 224,729,121 people shows no correlation between the proportion of Navajo and median female earnings in the United States with a correlation coefficient (R) of -0.011 and weighted average of $33,046, a difference of 5.9%.
Median Female Earnings Correlation Summary
| Measurement | Honduran | Navajo |
| Minimum | $12,102 | $16,070 |
| Maximum | $47,798 | $52,969 |
| Range | $35,696 | $36,899 |
| Mean | $30,670 | $30,327 |
| Median | $31,162 | $29,421 |
| Interquartile 25% (IQ1) | $26,901 | $26,466 |
| Interquartile 75% (IQ3) | $35,123 | $33,883 |
| Interquartile Range (IQR) | $8,221 | $7,417 |
| Standard Deviation (Sample) | $6,330 | $6,718 |
| Standard Deviation (Population) | $6,284 | $6,682 |
Similar Demographics by Median Female Earnings
Demographics Similar to Hondurans by Median Female Earnings
In terms of median female earnings, the demographic groups most similar to Hondurans are Chippewa ($35,003, a difference of 0.030%), Immigrants from Bahamas ($35,027, a difference of 0.040%), Sioux ($35,063, a difference of 0.14%), Ute ($34,960, a difference of 0.15%), and Yaqui ($34,943, a difference of 0.20%).
| Demographics | Rating | Rank | Median Female Earnings |
| Blacks/African Americans | 0.0 /100 | #302 | Tragic $35,315 |
| Immigrants | Latin America | 0.0 /100 | #303 | Tragic $35,307 |
| Crow | 0.0 /100 | #304 | Tragic $35,266 |
| Bahamians | 0.0 /100 | #305 | Tragic $35,125 |
| Fijians | 0.0 /100 | #306 | Tragic $35,114 |
| Sioux | 0.0 /100 | #307 | Tragic $35,063 |
| Immigrants | Bahamas | 0.0 /100 | #308 | Tragic $35,027 |
| Hondurans | 0.0 /100 | #309 | Tragic $35,013 |
| Chippewa | 0.0 /100 | #310 | Tragic $35,003 |
| Ute | 0.0 /100 | #311 | Tragic $34,960 |
| Yaqui | 0.0 /100 | #312 | Tragic $34,943 |
| Cubans | 0.0 /100 | #313 | Tragic $34,942 |
| Apache | 0.0 /100 | #314 | Tragic $34,895 |
| Pennsylvania Germans | 0.0 /100 | #315 | Tragic $34,802 |
| Cherokee | 0.0 /100 | #316 | Tragic $34,742 |
Demographics Similar to Navajo by Median Female Earnings
In terms of median female earnings, the demographic groups most similar to Navajo are Tohono O'odham ($33,205, a difference of 0.48%), Immigrants from Mexico ($33,236, a difference of 0.57%), Immigrants from Cuba ($33,291, a difference of 0.74%), Yakama ($33,354, a difference of 0.93%), and Yup'ik ($32,730, a difference of 0.96%).
| Demographics | Rating | Rank | Median Female Earnings |
| Mexicans | 0.0 /100 | #333 | Tragic $33,664 |
| Spanish American Indians | 0.0 /100 | #334 | Tragic $33,625 |
| Creek | 0.0 /100 | #335 | Tragic $33,437 |
| Ottawa | 0.0 /100 | #336 | Tragic $33,378 |
| Yakama | 0.0 /100 | #337 | Tragic $33,354 |
| Immigrants | Cuba | 0.0 /100 | #338 | Tragic $33,291 |
| Immigrants | Mexico | 0.0 /100 | #339 | Tragic $33,236 |
| Tohono O'odham | 0.0 /100 | #340 | Tragic $33,205 |
| Navajo | 0.0 /100 | #341 | Tragic $33,046 |
| Yup'ik | 0.0 /100 | #342 | Tragic $32,730 |
| Pueblo | 0.0 /100 | #343 | Tragic $32,564 |
| Lumbee | 0.0 /100 | #344 | Tragic $32,500 |
| Puerto Ricans | 0.0 /100 | #345 | Tragic $31,560 |
| Arapaho | 0.0 /100 | #346 | Tragic $31,489 |
| Houma | 0.0 /100 | #347 | Tragic $30,343 |