Spanish vs Navajo In Labor Force | Age 20-64
COMPARE
Spanish
Navajo
In Labor Force | Age 20-64
In Labor Force | Age 20-64 Comparison
Spanish
Navajo
78.2%
IN LABOR FORCE | AGE 20-64
0.0/ 100
METRIC RATING
275th/ 347
METRIC RANK
69.2%
IN LABOR FORCE | AGE 20-64
0.0/ 100
METRIC RATING
346th/ 347
METRIC RANK
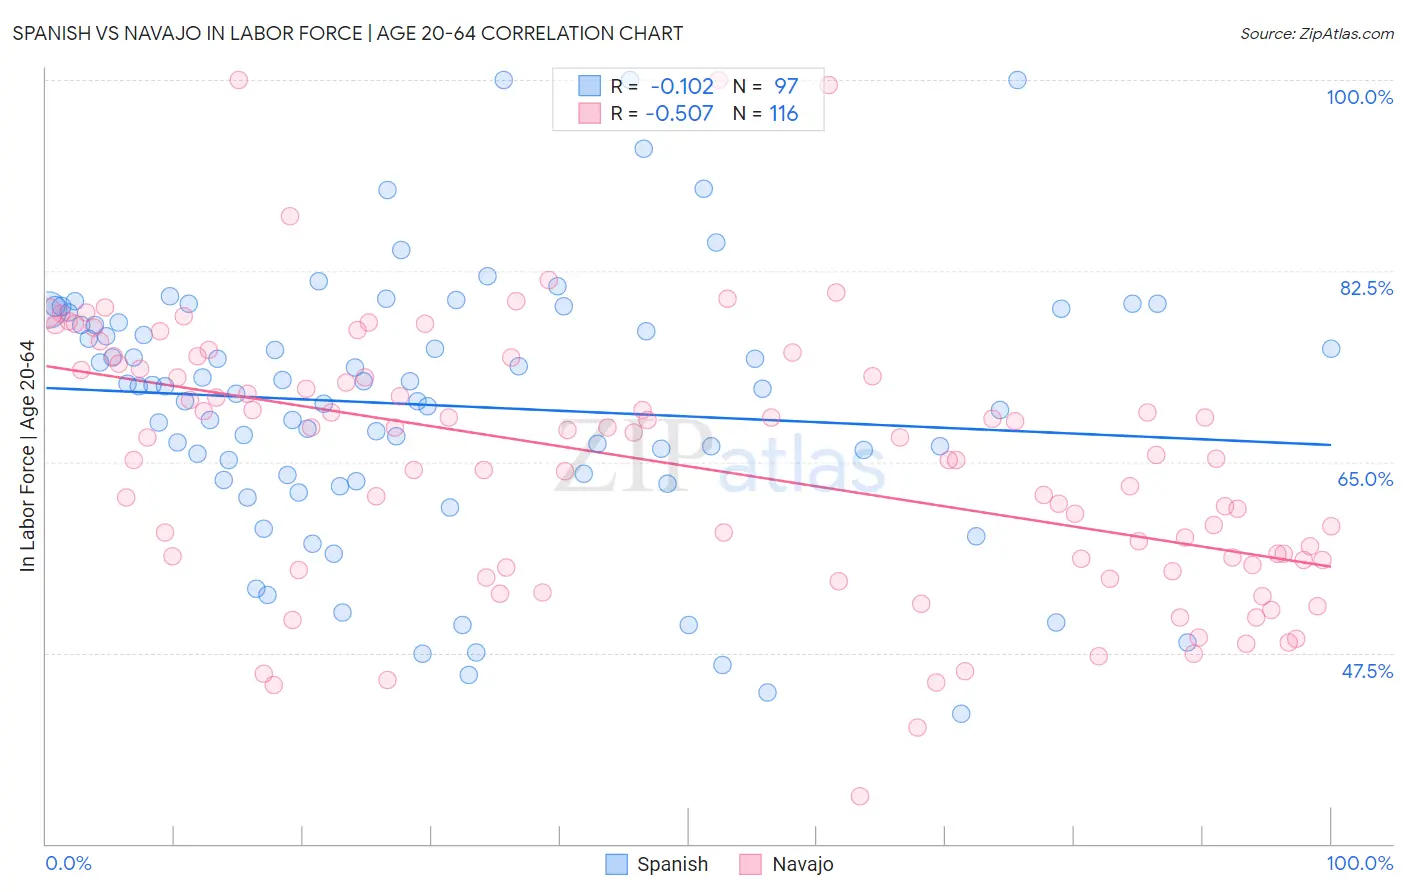
Spanish vs Navajo In Labor Force | Age 20-64 Correlation Chart
The statistical analysis conducted on geographies consisting of 422,183,269 people shows a poor negative correlation between the proportion of Spanish and labor force participation rate among population between the ages 20 and 64 in the United States with a correlation coefficient (R) of -0.102 and weighted average of 78.2%. Similarly, the statistical analysis conducted on geographies consisting of 224,851,077 people shows a substantial negative correlation between the proportion of Navajo and labor force participation rate among population between the ages 20 and 64 in the United States with a correlation coefficient (R) of -0.507 and weighted average of 69.2%, a difference of 13.1%.
In Labor Force | Age 20-64 Correlation Summary
| Measurement | Spanish | Navajo |
| Minimum | 41.9% | 34.4% |
| Maximum | 100.0% | 100.0% |
| Range | 58.1% | 65.6% |
| Mean | 70.2% | 64.9% |
| Median | 71.9% | 65.5% |
| Interquartile 25% (IQ1) | 63.6% | 55.8% |
| Interquartile 75% (IQ3) | 78.2% | 73.5% |
| Interquartile Range (IQR) | 14.7% | 17.7% |
| Standard Deviation (Sample) | 12.1% | 12.3% |
| Standard Deviation (Population) | 12.1% | 12.2% |
Similar Demographics by In Labor Force | Age 20-64
Demographics Similar to Spanish by In Labor Force | Age 20-64
In terms of in labor force | age 20-64, the demographic groups most similar to Spanish are Puget Sound Salish (78.2%, a difference of 0.0%), Aleut (78.2%, a difference of 0.010%), Immigrants from Bahamas (78.2%, a difference of 0.020%), Mexican American Indian (78.2%, a difference of 0.020%), and French American Indian (78.2%, a difference of 0.030%).
| Demographics | Rating | Rank | In Labor Force | Age 20-64 |
| West Indians | 0.0 /100 | #268 | Tragic 78.3% |
| Immigrants | Barbados | 0.0 /100 | #269 | Tragic 78.3% |
| Scotch-Irish | 0.0 /100 | #270 | Tragic 78.3% |
| Immigrants | Latin America | 0.0 /100 | #271 | Tragic 78.3% |
| Marshallese | 0.0 /100 | #272 | Tragic 78.3% |
| French American Indians | 0.0 /100 | #273 | Tragic 78.2% |
| Aleuts | 0.0 /100 | #274 | Tragic 78.2% |
| Spanish | 0.0 /100 | #275 | Tragic 78.2% |
| Puget Sound Salish | 0.0 /100 | #276 | Tragic 78.2% |
| Immigrants | Bahamas | 0.0 /100 | #277 | Tragic 78.2% |
| Mexican American Indians | 0.0 /100 | #278 | Tragic 78.2% |
| Belizeans | 0.0 /100 | #279 | Tragic 78.2% |
| Immigrants | Dominica | 0.0 /100 | #280 | Tragic 78.1% |
| Guyanese | 0.0 /100 | #281 | Tragic 78.1% |
| Immigrants | St. Vincent and the Grenadines | 0.0 /100 | #282 | Tragic 78.1% |
Demographics Similar to Navajo by In Labor Force | Age 20-64
In terms of in labor force | age 20-64, the demographic groups most similar to Navajo are Pima (69.0%, a difference of 0.16%), Tohono O'odham (70.4%, a difference of 1.8%), Lumbee (70.6%, a difference of 2.1%), Hopi (71.7%, a difference of 3.7%), and Yuman (71.7%, a difference of 3.7%).
| Demographics | Rating | Rank | In Labor Force | Age 20-64 |
| Natives/Alaskans | 0.0 /100 | #333 | Tragic 73.9% |
| Apache | 0.0 /100 | #334 | Tragic 73.7% |
| Ute | 0.0 /100 | #335 | Tragic 73.7% |
| Crow | 0.0 /100 | #336 | Tragic 73.3% |
| Yup'ik | 0.0 /100 | #337 | Tragic 73.2% |
| Puerto Ricans | 0.0 /100 | #338 | Tragic 73.1% |
| Houma | 0.0 /100 | #339 | Tragic 72.7% |
| Pueblo | 0.0 /100 | #340 | Tragic 72.6% |
| Immigrants | Yemen | 0.0 /100 | #341 | Tragic 72.3% |
| Yuman | 0.0 /100 | #342 | Tragic 71.7% |
| Hopi | 0.0 /100 | #343 | Tragic 71.7% |
| Lumbee | 0.0 /100 | #344 | Tragic 70.6% |
| Tohono O'odham | 0.0 /100 | #345 | Tragic 70.4% |
| Navajo | 0.0 /100 | #346 | Tragic 69.2% |
| Pima | 0.0 /100 | #347 | Tragic 69.0% |