Hmong vs German In Labor Force | Age 35-44
COMPARE
Hmong
German
In Labor Force | Age 35-44
In Labor Force | Age 35-44 Comparison
Hmong
Germans
82.6%
IN LABOR FORCE | AGE 35-44
0.0/ 100
METRIC RATING
297th/ 347
METRIC RANK
84.7%
IN LABOR FORCE | AGE 35-44
91.0/ 100
METRIC RATING
122nd/ 347
METRIC RANK
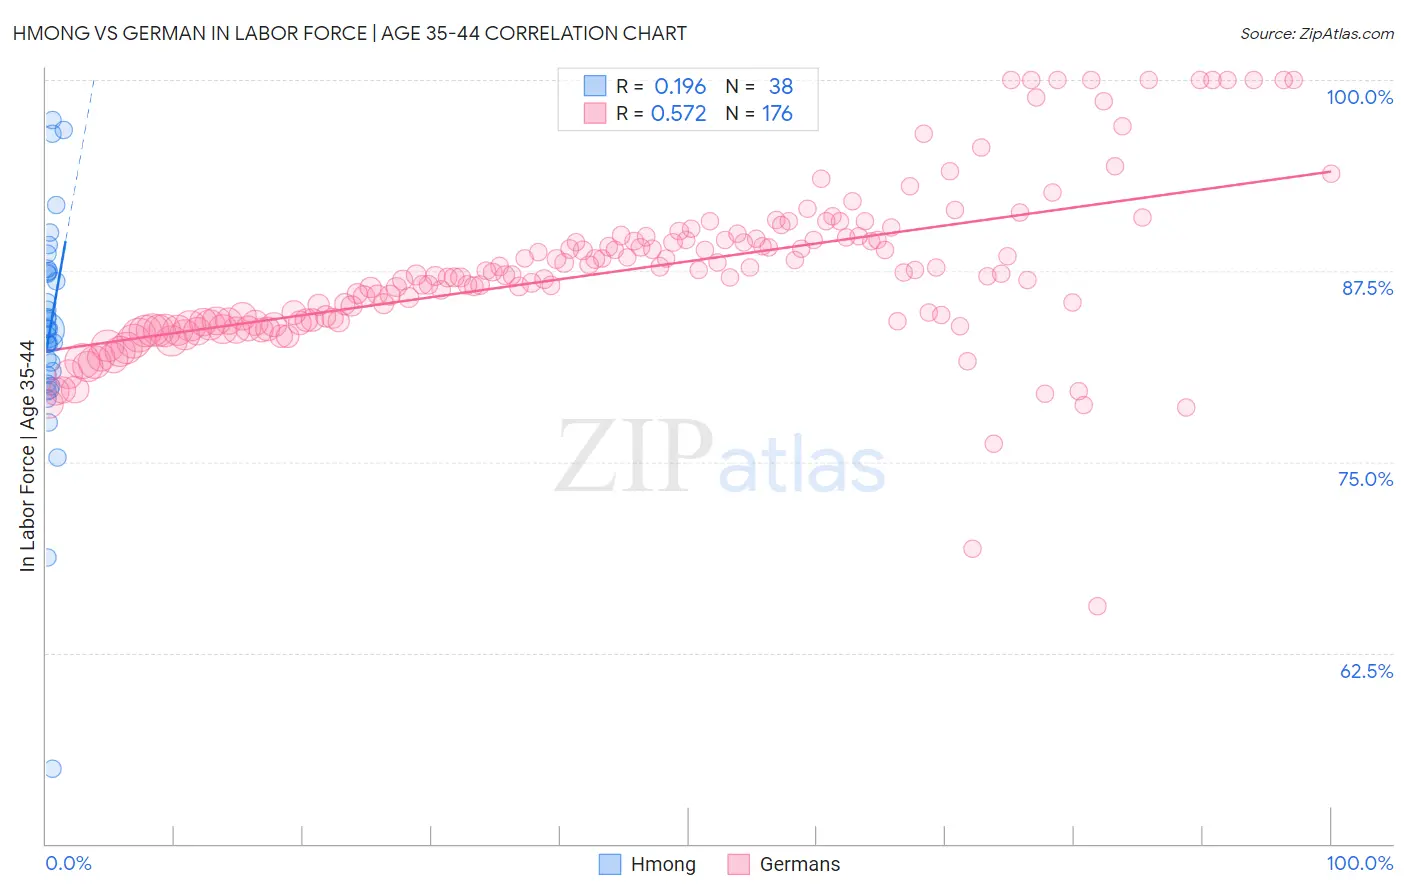
Hmong vs German In Labor Force | Age 35-44 Correlation Chart
The statistical analysis conducted on geographies consisting of 24,669,739 people shows a poor positive correlation between the proportion of Hmong and labor force participation rate among population between the ages 35 and 44 in the United States with a correlation coefficient (R) of 0.196 and weighted average of 82.6%. Similarly, the statistical analysis conducted on geographies consisting of 580,230,467 people shows a substantial positive correlation between the proportion of Germans and labor force participation rate among population between the ages 35 and 44 in the United States with a correlation coefficient (R) of 0.572 and weighted average of 84.7%, a difference of 2.6%.
In Labor Force | Age 35-44 Correlation Summary
| Measurement | Hmong | German |
| Minimum | 54.9% | 65.5% |
| Maximum | 97.4% | 100.0% |
| Range | 42.5% | 34.5% |
| Mean | 83.6% | 87.5% |
| Median | 83.7% | 87.2% |
| Interquartile 25% (IQ1) | 80.7% | 84.1% |
| Interquartile 75% (IQ3) | 87.4% | 89.6% |
| Interquartile Range (IQR) | 6.7% | 5.5% |
| Standard Deviation (Sample) | 7.4% | 5.4% |
| Standard Deviation (Population) | 7.3% | 5.4% |
Similar Demographics by In Labor Force | Age 35-44
Demographics Similar to Hmong by In Labor Force | Age 35-44
In terms of in labor force | age 35-44, the demographic groups most similar to Hmong are Mexican American Indian (82.6%, a difference of 0.010%), Ottawa (82.6%, a difference of 0.020%), Tlingit-Haida (82.5%, a difference of 0.030%), Central American Indian (82.5%, a difference of 0.090%), and Immigrants from Lebanon (82.7%, a difference of 0.10%).
| Demographics | Rating | Rank | In Labor Force | Age 35-44 |
| Africans | 0.0 /100 | #290 | Tragic 82.9% |
| Pennsylvania Germans | 0.0 /100 | #291 | Tragic 82.9% |
| Immigrants | Latin America | 0.0 /100 | #292 | Tragic 82.8% |
| Spanish Americans | 0.0 /100 | #293 | Tragic 82.8% |
| Potawatomi | 0.0 /100 | #294 | Tragic 82.7% |
| Immigrants | Lebanon | 0.0 /100 | #295 | Tragic 82.7% |
| Mexican American Indians | 0.0 /100 | #296 | Tragic 82.6% |
| Hmong | 0.0 /100 | #297 | Tragic 82.6% |
| Ottawa | 0.0 /100 | #298 | Tragic 82.6% |
| Tlingit-Haida | 0.0 /100 | #299 | Tragic 82.5% |
| Central American Indians | 0.0 /100 | #300 | Tragic 82.5% |
| Spanish American Indians | 0.0 /100 | #301 | Tragic 82.5% |
| Americans | 0.0 /100 | #302 | Tragic 82.4% |
| Nepalese | 0.0 /100 | #303 | Tragic 82.4% |
| Marshallese | 0.0 /100 | #304 | Tragic 82.4% |
Demographics Similar to Germans by In Labor Force | Age 35-44
In terms of in labor force | age 35-44, the demographic groups most similar to Germans are Finnish (84.7%, a difference of 0.0%), Immigrants from South America (84.7%, a difference of 0.0%), Slavic (84.7%, a difference of 0.0%), Burmese (84.7%, a difference of 0.010%), and Immigrants from Northern Europe (84.7%, a difference of 0.010%).
| Demographics | Rating | Rank | In Labor Force | Age 35-44 |
| Bahamians | 93.2 /100 | #115 | Exceptional 84.7% |
| Immigrants | Egypt | 92.7 /100 | #116 | Exceptional 84.7% |
| Immigrants | China | 92.3 /100 | #117 | Exceptional 84.7% |
| Immigrants | Eastern Asia | 92.1 /100 | #118 | Exceptional 84.7% |
| Burmese | 91.8 /100 | #119 | Exceptional 84.7% |
| Immigrants | Northern Europe | 91.5 /100 | #120 | Exceptional 84.7% |
| Finns | 91.2 /100 | #121 | Exceptional 84.7% |
| Germans | 91.0 /100 | #122 | Exceptional 84.7% |
| Immigrants | South America | 90.9 /100 | #123 | Exceptional 84.7% |
| Slavs | 90.8 /100 | #124 | Exceptional 84.7% |
| Maltese | 90.8 /100 | #125 | Exceptional 84.7% |
| Asians | 90.6 /100 | #126 | Exceptional 84.7% |
| Immigrants | Spain | 90.6 /100 | #127 | Exceptional 84.7% |
| Immigrants | Ghana | 90.4 /100 | #128 | Exceptional 84.7% |
| Palestinians | 89.7 /100 | #129 | Excellent 84.7% |