Hmong vs British In Labor Force | Age 35-44
COMPARE
Hmong
British
In Labor Force | Age 35-44
In Labor Force | Age 35-44 Comparison
Hmong
British
82.6%
IN LABOR FORCE | AGE 35-44
0.0/ 100
METRIC RATING
297th/ 347
METRIC RANK
84.2%
IN LABOR FORCE | AGE 35-44
23.0/ 100
METRIC RATING
201st/ 347
METRIC RANK
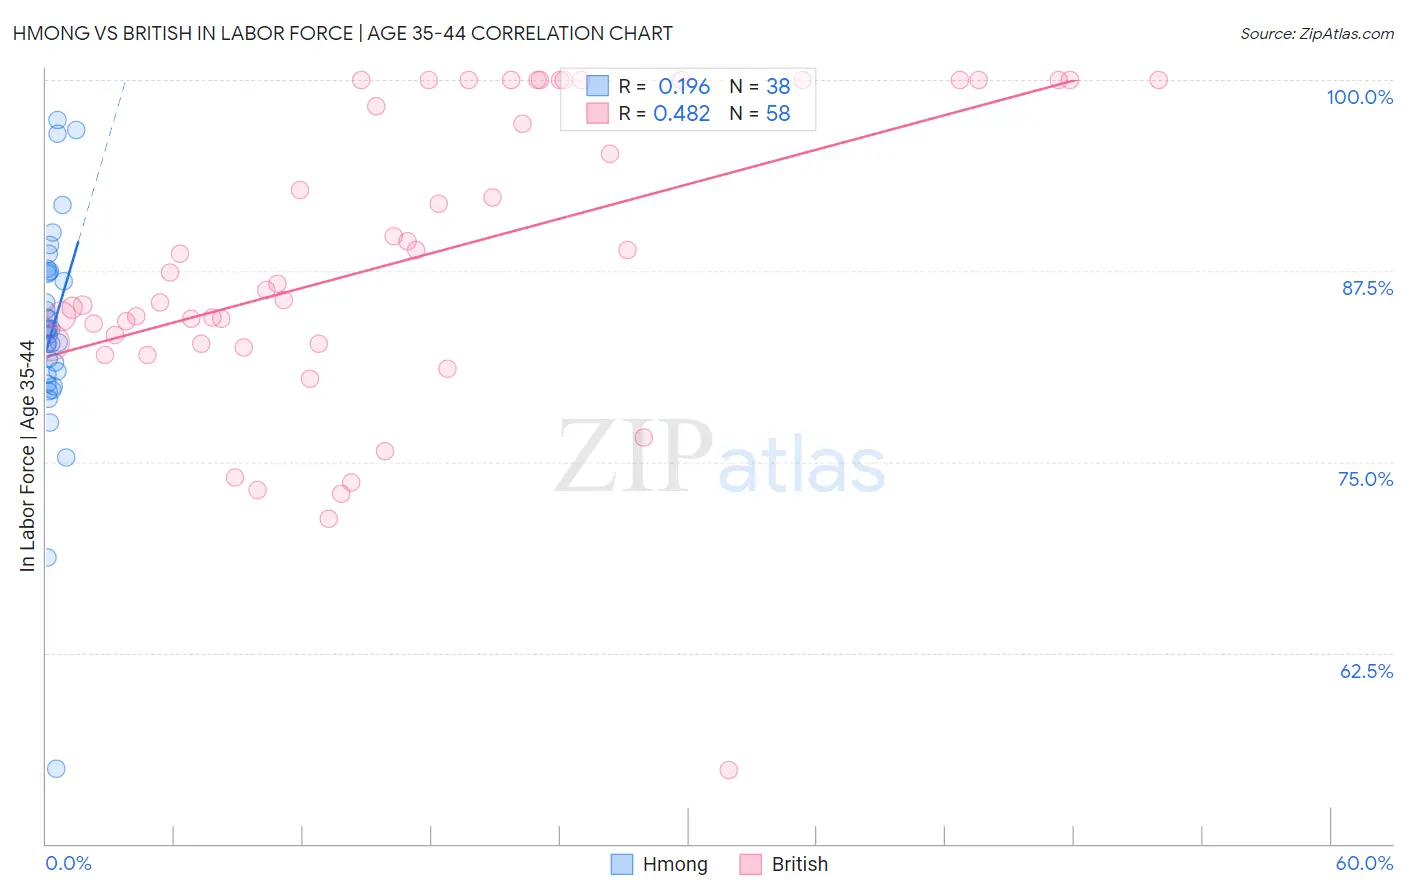
Hmong vs British In Labor Force | Age 35-44 Correlation Chart
The statistical analysis conducted on geographies consisting of 24,669,739 people shows a poor positive correlation between the proportion of Hmong and labor force participation rate among population between the ages 35 and 44 in the United States with a correlation coefficient (R) of 0.196 and weighted average of 82.6%. Similarly, the statistical analysis conducted on geographies consisting of 531,027,456 people shows a moderate positive correlation between the proportion of British and labor force participation rate among population between the ages 35 and 44 in the United States with a correlation coefficient (R) of 0.482 and weighted average of 84.2%, a difference of 2.0%.
In Labor Force | Age 35-44 Correlation Summary
| Measurement | Hmong | British |
| Minimum | 54.9% | 54.8% |
| Maximum | 97.4% | 100.0% |
| Range | 42.5% | 45.2% |
| Mean | 83.6% | 88.2% |
| Median | 83.7% | 86.4% |
| Interquartile 25% (IQ1) | 80.7% | 82.8% |
| Interquartile 75% (IQ3) | 87.4% | 100.0% |
| Interquartile Range (IQR) | 6.7% | 17.2% |
| Standard Deviation (Sample) | 7.4% | 9.9% |
| Standard Deviation (Population) | 7.3% | 9.8% |
Similar Demographics by In Labor Force | Age 35-44
Demographics Similar to Hmong by In Labor Force | Age 35-44
In terms of in labor force | age 35-44, the demographic groups most similar to Hmong are Mexican American Indian (82.6%, a difference of 0.010%), Ottawa (82.6%, a difference of 0.020%), Tlingit-Haida (82.5%, a difference of 0.030%), Central American Indian (82.5%, a difference of 0.090%), and Immigrants from Lebanon (82.7%, a difference of 0.10%).
| Demographics | Rating | Rank | In Labor Force | Age 35-44 |
| Africans | 0.0 /100 | #290 | Tragic 82.9% |
| Pennsylvania Germans | 0.0 /100 | #291 | Tragic 82.9% |
| Immigrants | Latin America | 0.0 /100 | #292 | Tragic 82.8% |
| Spanish Americans | 0.0 /100 | #293 | Tragic 82.8% |
| Potawatomi | 0.0 /100 | #294 | Tragic 82.7% |
| Immigrants | Lebanon | 0.0 /100 | #295 | Tragic 82.7% |
| Mexican American Indians | 0.0 /100 | #296 | Tragic 82.6% |
| Hmong | 0.0 /100 | #297 | Tragic 82.6% |
| Ottawa | 0.0 /100 | #298 | Tragic 82.6% |
| Tlingit-Haida | 0.0 /100 | #299 | Tragic 82.5% |
| Central American Indians | 0.0 /100 | #300 | Tragic 82.5% |
| Spanish American Indians | 0.0 /100 | #301 | Tragic 82.5% |
| Americans | 0.0 /100 | #302 | Tragic 82.4% |
| Nepalese | 0.0 /100 | #303 | Tragic 82.4% |
| Marshallese | 0.0 /100 | #304 | Tragic 82.4% |
Demographics Similar to British by In Labor Force | Age 35-44
In terms of in labor force | age 35-44, the demographic groups most similar to British are Syrian (84.2%, a difference of 0.0%), Moroccan (84.2%, a difference of 0.0%), Immigrants from Uzbekistan (84.2%, a difference of 0.0%), Ecuadorian (84.2%, a difference of 0.010%), and Immigrants from South Eastern Asia (84.2%, a difference of 0.010%).
| Demographics | Rating | Rank | In Labor Force | Age 35-44 |
| Immigrants | Indonesia | 25.7 /100 | #194 | Fair 84.2% |
| Immigrants | Caribbean | 25.7 /100 | #195 | Fair 84.2% |
| Immigrants | England | 25.0 /100 | #196 | Fair 84.2% |
| Immigrants | Western Europe | 24.7 /100 | #197 | Fair 84.2% |
| Ecuadorians | 24.0 /100 | #198 | Fair 84.2% |
| Syrians | 23.2 /100 | #199 | Fair 84.2% |
| Moroccans | 23.2 /100 | #200 | Fair 84.2% |
| British | 23.0 /100 | #201 | Fair 84.2% |
| Immigrants | Uzbekistan | 22.8 /100 | #202 | Fair 84.2% |
| Immigrants | South Eastern Asia | 22.4 /100 | #203 | Fair 84.2% |
| Canadians | 19.9 /100 | #204 | Poor 84.2% |
| Immigrants | Canada | 19.6 /100 | #205 | Poor 84.2% |
| Immigrants | Costa Rica | 19.5 /100 | #206 | Poor 84.2% |
| Laotians | 19.0 /100 | #207 | Poor 84.2% |
| Immigrants | North America | 18.1 /100 | #208 | Poor 84.2% |