Hmong vs Immigrants from Cuba In Labor Force | Age 20-64
COMPARE
Hmong
Immigrants from Cuba
In Labor Force | Age 20-64
In Labor Force | Age 20-64 Comparison
Hmong
Immigrants from Cuba
77.9%
IN LABOR FORCE | AGE 20-64
0.0/ 100
METRIC RATING
288th/ 347
METRIC RANK
79.7%
IN LABOR FORCE | AGE 20-64
66.7/ 100
METRIC RATING
159th/ 347
METRIC RANK
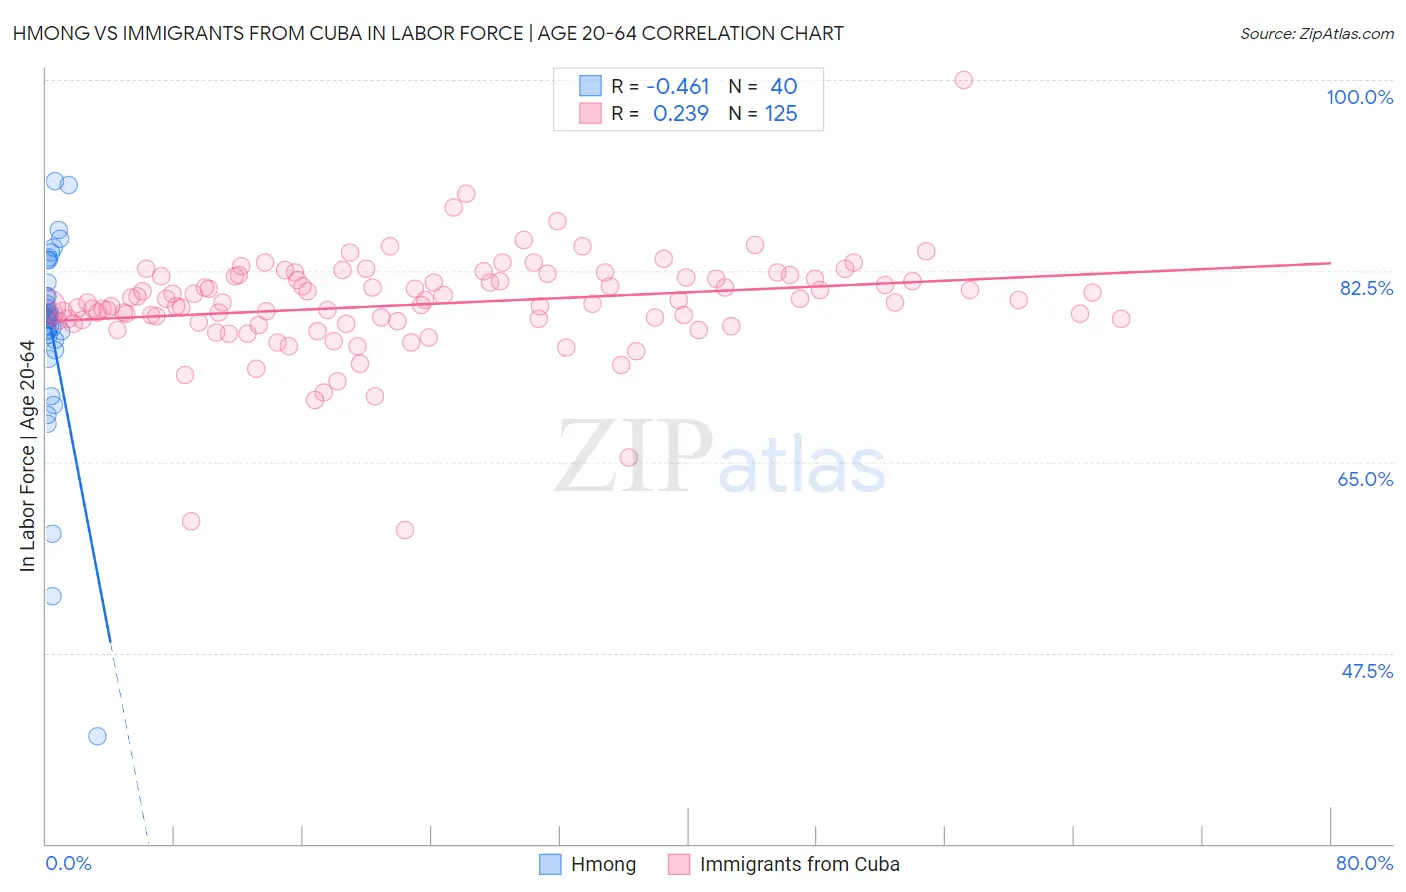
Hmong vs Immigrants from Cuba In Labor Force | Age 20-64 Correlation Chart
The statistical analysis conducted on geographies consisting of 24,681,537 people shows a moderate negative correlation between the proportion of Hmong and labor force participation rate among population between the ages 20 and 64 in the United States with a correlation coefficient (R) of -0.461 and weighted average of 77.9%. Similarly, the statistical analysis conducted on geographies consisting of 326,009,980 people shows a weak positive correlation between the proportion of Immigrants from Cuba and labor force participation rate among population between the ages 20 and 64 in the United States with a correlation coefficient (R) of 0.239 and weighted average of 79.7%, a difference of 2.3%.
In Labor Force | Age 20-64 Correlation Summary
| Measurement | Hmong | Immigrants from Cuba |
| Minimum | 39.8% | 58.8% |
| Maximum | 90.7% | 100.0% |
| Range | 50.9% | 41.2% |
| Mean | 76.8% | 79.4% |
| Median | 78.2% | 79.6% |
| Interquartile 25% (IQ1) | 76.4% | 77.9% |
| Interquartile 75% (IQ3) | 80.8% | 81.9% |
| Interquartile Range (IQR) | 4.4% | 3.9% |
| Standard Deviation (Sample) | 9.3% | 4.7% |
| Standard Deviation (Population) | 9.2% | 4.7% |
Similar Demographics by In Labor Force | Age 20-64
Demographics Similar to Hmong by In Labor Force | Age 20-64
In terms of in labor force | age 20-64, the demographic groups most similar to Hmong are African (77.9%, a difference of 0.010%), Immigrants from Bangladesh (77.9%, a difference of 0.020%), Vietnamese (78.0%, a difference of 0.070%), Immigrants from Belize (78.0%, a difference of 0.080%), and Spanish American (77.8%, a difference of 0.080%).
| Demographics | Rating | Rank | In Labor Force | Age 20-64 |
| Guyanese | 0.0 /100 | #281 | Tragic 78.1% |
| Immigrants | St. Vincent and the Grenadines | 0.0 /100 | #282 | Tragic 78.1% |
| Immigrants | Nonimmigrants | 0.0 /100 | #283 | Tragic 78.1% |
| Immigrants | Guyana | 0.0 /100 | #284 | Tragic 78.1% |
| Osage | 0.0 /100 | #285 | Tragic 78.0% |
| Immigrants | Belize | 0.0 /100 | #286 | Tragic 78.0% |
| Vietnamese | 0.0 /100 | #287 | Tragic 78.0% |
| Hmong | 0.0 /100 | #288 | Tragic 77.9% |
| Africans | 0.0 /100 | #289 | Tragic 77.9% |
| Immigrants | Bangladesh | 0.0 /100 | #290 | Tragic 77.9% |
| Spanish Americans | 0.0 /100 | #291 | Tragic 77.8% |
| Immigrants | Azores | 0.0 /100 | #292 | Tragic 77.8% |
| Delaware | 0.0 /100 | #293 | Tragic 77.8% |
| Immigrants | Central America | 0.0 /100 | #294 | Tragic 77.7% |
| Immigrants | Grenada | 0.0 /100 | #295 | Tragic 77.7% |
Demographics Similar to Immigrants from Cuba by In Labor Force | Age 20-64
In terms of in labor force | age 20-64, the demographic groups most similar to Immigrants from Cuba are Moroccan (79.7%, a difference of 0.0%), South African (79.7%, a difference of 0.0%), Austrian (79.7%, a difference of 0.010%), German (79.7%, a difference of 0.010%), and New Zealander (79.7%, a difference of 0.020%).
| Demographics | Rating | Rank | In Labor Force | Age 20-64 |
| Immigrants | Northern Europe | 72.0 /100 | #152 | Good 79.7% |
| Immigrants | Kazakhstan | 69.5 /100 | #153 | Good 79.7% |
| New Zealanders | 69.4 /100 | #154 | Good 79.7% |
| Immigrants | South Africa | 69.2 /100 | #155 | Good 79.7% |
| Senegalese | 69.1 /100 | #156 | Good 79.7% |
| Immigrants | China | 69.1 /100 | #157 | Good 79.7% |
| Austrians | 67.6 /100 | #158 | Good 79.7% |
| Immigrants | Cuba | 66.7 /100 | #159 | Good 79.7% |
| Moroccans | 66.7 /100 | #160 | Good 79.7% |
| South Africans | 66.2 /100 | #161 | Good 79.7% |
| Germans | 65.2 /100 | #162 | Good 79.7% |
| Immigrants | Costa Rica | 64.6 /100 | #163 | Good 79.7% |
| Immigrants | Burma/Myanmar | 64.4 /100 | #164 | Good 79.7% |
| Nigerians | 64.0 /100 | #165 | Good 79.7% |
| Okinawans | 62.7 /100 | #166 | Good 79.6% |