Hmong vs Immigrants from Cuba Professional Degree
COMPARE
Hmong
Immigrants from Cuba
Professional Degree
Professional Degree Comparison
Hmong
Immigrants from Cuba
3.7%
PROFESSIONAL DEGREE
1.6/ 100
METRIC RATING
248th/ 347
METRIC RANK
3.6%
PROFESSIONAL DEGREE
0.6/ 100
METRIC RATING
269th/ 347
METRIC RANK
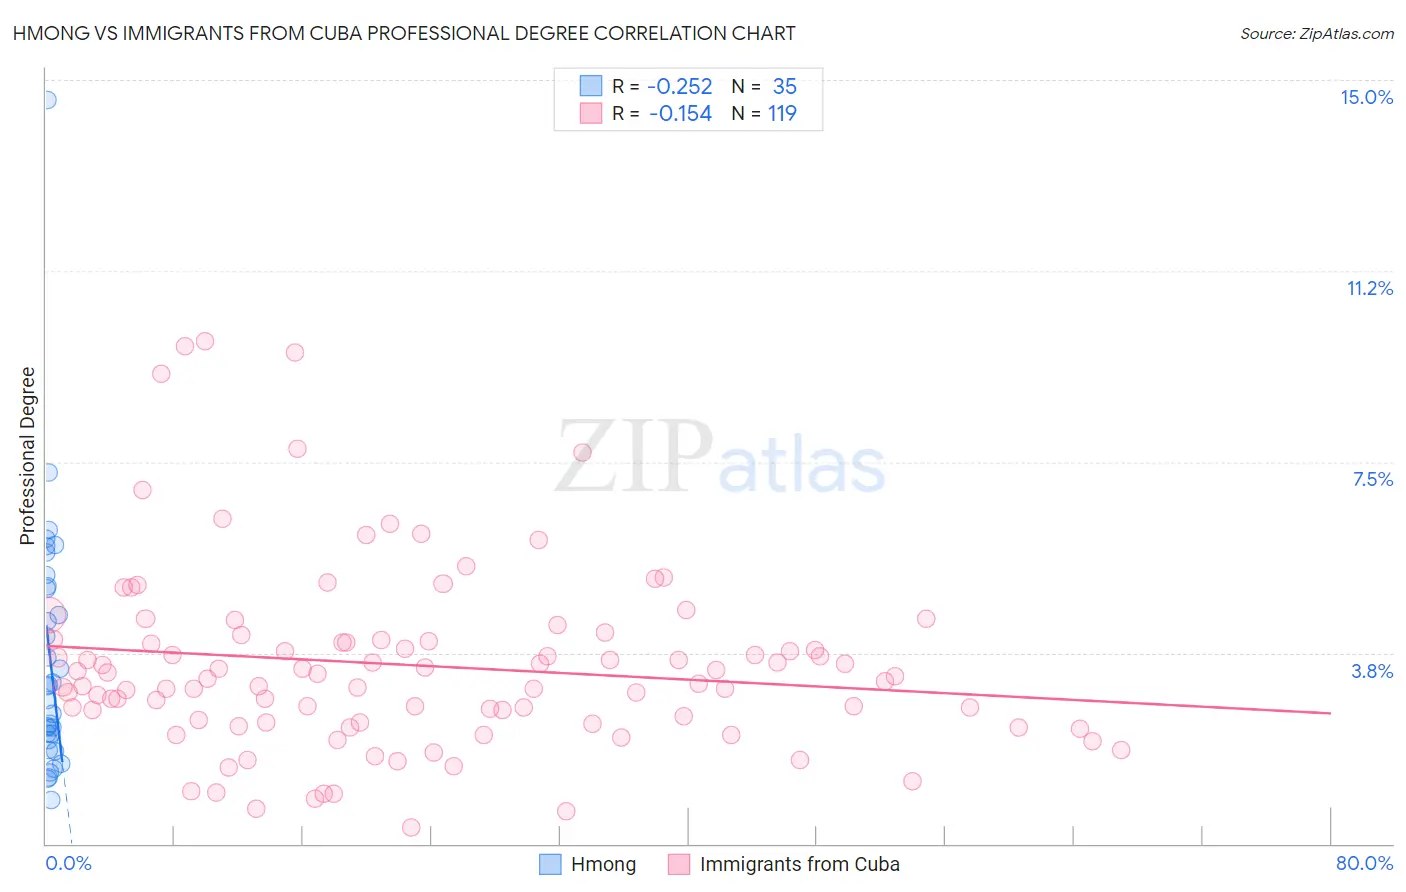
Hmong vs Immigrants from Cuba Professional Degree Correlation Chart
The statistical analysis conducted on geographies consisting of 24,646,446 people shows a weak negative correlation between the proportion of Hmong and percentage of population with at least professional degree education in the United States with a correlation coefficient (R) of -0.252 and weighted average of 3.7%. Similarly, the statistical analysis conducted on geographies consisting of 325,367,242 people shows a poor negative correlation between the proportion of Immigrants from Cuba and percentage of population with at least professional degree education in the United States with a correlation coefficient (R) of -0.154 and weighted average of 3.6%, a difference of 4.2%.
Professional Degree Correlation Summary
| Measurement | Hmong | Immigrants from Cuba |
| Minimum | 0.86% | 0.31% |
| Maximum | 14.6% | 9.9% |
| Range | 13.7% | 9.6% |
| Mean | 3.7% | 3.5% |
| Median | 3.1% | 3.2% |
| Interquartile 25% (IQ1) | 2.0% | 2.4% |
| Interquartile 75% (IQ3) | 5.1% | 4.0% |
| Interquartile Range (IQR) | 3.0% | 1.6% |
| Standard Deviation (Sample) | 2.6% | 1.8% |
| Standard Deviation (Population) | 2.5% | 1.8% |
Similar Demographics by Professional Degree
Demographics Similar to Hmong by Professional Degree
In terms of professional degree, the demographic groups most similar to Hmong are Immigrants from Grenada (3.7%, a difference of 0.11%), Guyanese (3.8%, a difference of 0.16%), Marshallese (3.8%, a difference of 0.18%), Immigrants from Fiji (3.7%, a difference of 0.18%), and French American Indian (3.8%, a difference of 0.36%).
| Demographics | Rating | Rank | Professional Degree |
| Alaskan Athabascans | 2.3 /100 | #241 | Tragic 3.8% |
| Native Hawaiians | 2.3 /100 | #242 | Tragic 3.8% |
| Guamanians/Chamorros | 2.2 /100 | #243 | Tragic 3.8% |
| Immigrants | Bahamas | 2.0 /100 | #244 | Tragic 3.8% |
| French American Indians | 1.7 /100 | #245 | Tragic 3.8% |
| Marshallese | 1.7 /100 | #246 | Tragic 3.8% |
| Guyanese | 1.6 /100 | #247 | Tragic 3.8% |
| Hmong | 1.6 /100 | #248 | Tragic 3.7% |
| Immigrants | Grenada | 1.5 /100 | #249 | Tragic 3.7% |
| Immigrants | Fiji | 1.5 /100 | #250 | Tragic 3.7% |
| Immigrants | Nicaragua | 1.4 /100 | #251 | Tragic 3.7% |
| Jamaicans | 1.4 /100 | #252 | Tragic 3.7% |
| Pueblo | 1.4 /100 | #253 | Tragic 3.7% |
| Tongans | 1.3 /100 | #254 | Tragic 3.7% |
| Osage | 1.2 /100 | #255 | Tragic 3.7% |
Demographics Similar to Immigrants from Cuba by Professional Degree
In terms of professional degree, the demographic groups most similar to Immigrants from Cuba are Central American (3.6%, a difference of 0.29%), Aleut (3.6%, a difference of 0.60%), Delaware (3.6%, a difference of 0.75%), Belizean (3.6%, a difference of 0.76%), and Immigrants from Jamaica (3.6%, a difference of 0.78%).
| Demographics | Rating | Rank | Professional Degree |
| U.S. Virgin Islanders | 1.0 /100 | #262 | Tragic 3.7% |
| Hopi | 0.9 /100 | #263 | Tragic 3.6% |
| Immigrants | Cambodia | 0.9 /100 | #264 | Tragic 3.6% |
| Immigrants | Congo | 0.8 /100 | #265 | Tragic 3.6% |
| Central American Indians | 0.8 /100 | #266 | Tragic 3.6% |
| Delaware | 0.7 /100 | #267 | Tragic 3.6% |
| Aleuts | 0.7 /100 | #268 | Tragic 3.6% |
| Immigrants | Cuba | 0.6 /100 | #269 | Tragic 3.6% |
| Central Americans | 0.6 /100 | #270 | Tragic 3.6% |
| Belizeans | 0.5 /100 | #271 | Tragic 3.6% |
| Immigrants | Jamaica | 0.5 /100 | #272 | Tragic 3.6% |
| Americans | 0.5 /100 | #273 | Tragic 3.6% |
| Potawatomi | 0.5 /100 | #274 | Tragic 3.6% |
| Immigrants | Dominica | 0.5 /100 | #275 | Tragic 3.6% |
| Liberians | 0.5 /100 | #276 | Tragic 3.6% |