Hmong vs Immigrants from Caribbean In Labor Force | Age 20-64
COMPARE
Hmong
Immigrants from Caribbean
In Labor Force | Age 20-64
In Labor Force | Age 20-64 Comparison
Hmong
Immigrants from Caribbean
77.9%
IN LABOR FORCE | AGE 20-64
0.0/ 100
METRIC RATING
288th/ 347
METRIC RANK
78.8%
IN LABOR FORCE | AGE 20-64
1.0/ 100
METRIC RATING
248th/ 347
METRIC RANK
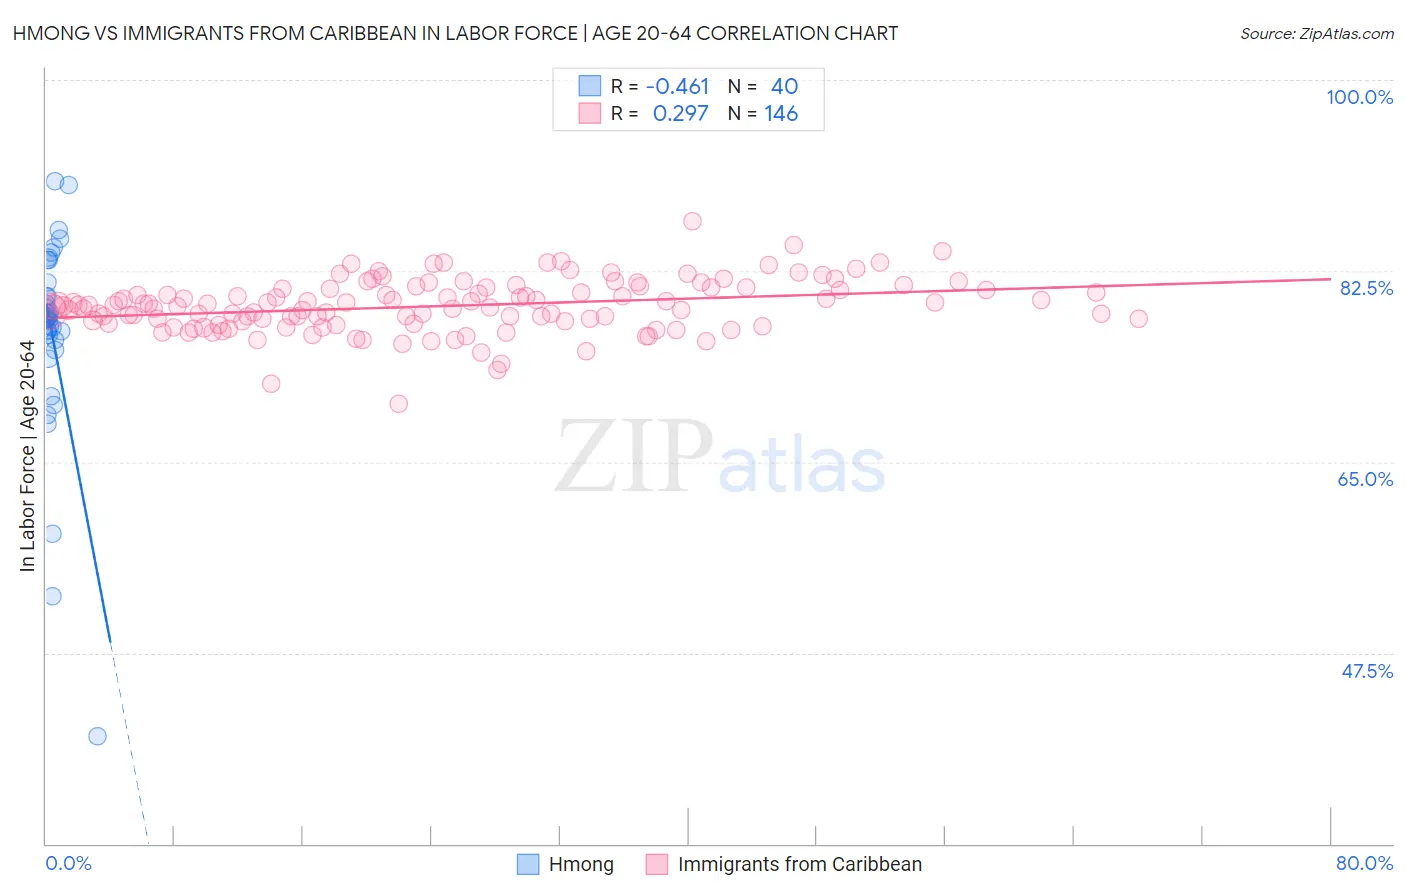
Hmong vs Immigrants from Caribbean In Labor Force | Age 20-64 Correlation Chart
The statistical analysis conducted on geographies consisting of 24,681,537 people shows a moderate negative correlation between the proportion of Hmong and labor force participation rate among population between the ages 20 and 64 in the United States with a correlation coefficient (R) of -0.461 and weighted average of 77.9%. Similarly, the statistical analysis conducted on geographies consisting of 450,041,805 people shows a weak positive correlation between the proportion of Immigrants from Caribbean and labor force participation rate among population between the ages 20 and 64 in the United States with a correlation coefficient (R) of 0.297 and weighted average of 78.8%, a difference of 1.2%.
In Labor Force | Age 20-64 Correlation Summary
| Measurement | Hmong | Immigrants from Caribbean |
| Minimum | 39.8% | 70.3% |
| Maximum | 90.7% | 87.0% |
| Range | 50.9% | 16.7% |
| Mean | 76.8% | 79.3% |
| Median | 78.2% | 79.3% |
| Interquartile 25% (IQ1) | 76.4% | 77.9% |
| Interquartile 75% (IQ3) | 80.8% | 80.9% |
| Interquartile Range (IQR) | 4.4% | 3.0% |
| Standard Deviation (Sample) | 9.3% | 2.4% |
| Standard Deviation (Population) | 9.2% | 2.4% |
Similar Demographics by In Labor Force | Age 20-64
Demographics Similar to Hmong by In Labor Force | Age 20-64
In terms of in labor force | age 20-64, the demographic groups most similar to Hmong are African (77.9%, a difference of 0.010%), Immigrants from Bangladesh (77.9%, a difference of 0.020%), Vietnamese (78.0%, a difference of 0.070%), Immigrants from Belize (78.0%, a difference of 0.080%), and Spanish American (77.8%, a difference of 0.080%).
| Demographics | Rating | Rank | In Labor Force | Age 20-64 |
| Guyanese | 0.0 /100 | #281 | Tragic 78.1% |
| Immigrants | St. Vincent and the Grenadines | 0.0 /100 | #282 | Tragic 78.1% |
| Immigrants | Nonimmigrants | 0.0 /100 | #283 | Tragic 78.1% |
| Immigrants | Guyana | 0.0 /100 | #284 | Tragic 78.1% |
| Osage | 0.0 /100 | #285 | Tragic 78.0% |
| Immigrants | Belize | 0.0 /100 | #286 | Tragic 78.0% |
| Vietnamese | 0.0 /100 | #287 | Tragic 78.0% |
| Hmong | 0.0 /100 | #288 | Tragic 77.9% |
| Africans | 0.0 /100 | #289 | Tragic 77.9% |
| Immigrants | Bangladesh | 0.0 /100 | #290 | Tragic 77.9% |
| Spanish Americans | 0.0 /100 | #291 | Tragic 77.8% |
| Immigrants | Azores | 0.0 /100 | #292 | Tragic 77.8% |
| Delaware | 0.0 /100 | #293 | Tragic 77.8% |
| Immigrants | Central America | 0.0 /100 | #294 | Tragic 77.7% |
| Immigrants | Grenada | 0.0 /100 | #295 | Tragic 77.7% |
Demographics Similar to Immigrants from Caribbean by In Labor Force | Age 20-64
In terms of in labor force | age 20-64, the demographic groups most similar to Immigrants from Caribbean are Immigrants from Germany (78.8%, a difference of 0.010%), Immigrants from Trinidad and Tobago (78.8%, a difference of 0.020%), English (78.8%, a difference of 0.030%), Honduran (78.8%, a difference of 0.030%), and Scottish (78.9%, a difference of 0.050%).
| Demographics | Rating | Rank | In Labor Force | Age 20-64 |
| Jamaicans | 2.0 /100 | #241 | Tragic 78.9% |
| Immigrants | Micronesia | 1.9 /100 | #242 | Tragic 78.9% |
| Immigrants | West Indies | 1.7 /100 | #243 | Tragic 78.9% |
| French | 1.5 /100 | #244 | Tragic 78.9% |
| Scottish | 1.3 /100 | #245 | Tragic 78.9% |
| Immigrants | Trinidad and Tobago | 1.1 /100 | #246 | Tragic 78.8% |
| Immigrants | Germany | 1.0 /100 | #247 | Tragic 78.8% |
| Immigrants | Caribbean | 1.0 /100 | #248 | Tragic 78.8% |
| English | 0.9 /100 | #249 | Tragic 78.8% |
| Hondurans | 0.8 /100 | #250 | Tragic 78.8% |
| Barbadians | 0.7 /100 | #251 | Tragic 78.8% |
| Immigrants | Honduras | 0.6 /100 | #252 | Tragic 78.7% |
| Basques | 0.5 /100 | #253 | Tragic 78.7% |
| Immigrants | Lebanon | 0.5 /100 | #254 | Tragic 78.7% |
| Hawaiians | 0.5 /100 | #255 | Tragic 78.7% |