Hmong vs Czech In Labor Force | Age 20-64
COMPARE
Hmong
Czech
In Labor Force | Age 20-64
In Labor Force | Age 20-64 Comparison
Hmong
Czechs
77.9%
IN LABOR FORCE | AGE 20-64
0.0/ 100
METRIC RATING
288th/ 347
METRIC RANK
80.5%
IN LABOR FORCE | AGE 20-64
99.7/ 100
METRIC RATING
43rd/ 347
METRIC RANK
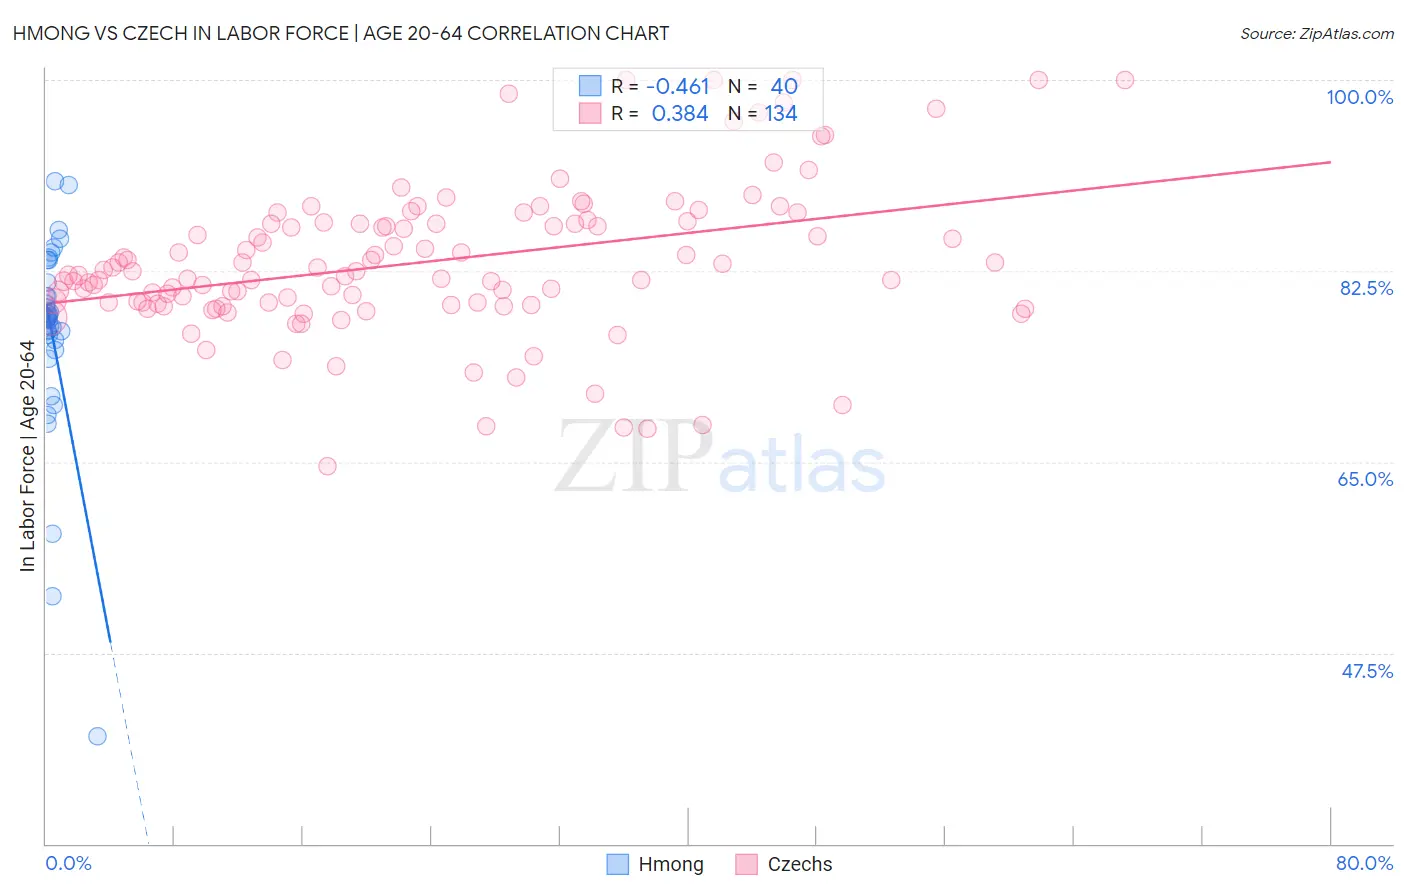
Hmong vs Czech In Labor Force | Age 20-64 Correlation Chart
The statistical analysis conducted on geographies consisting of 24,681,537 people shows a moderate negative correlation between the proportion of Hmong and labor force participation rate among population between the ages 20 and 64 in the United States with a correlation coefficient (R) of -0.461 and weighted average of 77.9%. Similarly, the statistical analysis conducted on geographies consisting of 484,822,871 people shows a mild positive correlation between the proportion of Czechs and labor force participation rate among population between the ages 20 and 64 in the United States with a correlation coefficient (R) of 0.384 and weighted average of 80.5%, a difference of 3.3%.
In Labor Force | Age 20-64 Correlation Summary
| Measurement | Hmong | Czech |
| Minimum | 39.8% | 64.6% |
| Maximum | 90.7% | 100.0% |
| Range | 50.9% | 35.4% |
| Mean | 76.8% | 83.3% |
| Median | 78.2% | 82.3% |
| Interquartile 25% (IQ1) | 76.4% | 79.6% |
| Interquartile 75% (IQ3) | 80.8% | 86.8% |
| Interquartile Range (IQR) | 4.4% | 7.3% |
| Standard Deviation (Sample) | 9.3% | 6.9% |
| Standard Deviation (Population) | 9.2% | 6.8% |
Similar Demographics by In Labor Force | Age 20-64
Demographics Similar to Hmong by In Labor Force | Age 20-64
In terms of in labor force | age 20-64, the demographic groups most similar to Hmong are African (77.9%, a difference of 0.010%), Immigrants from Bangladesh (77.9%, a difference of 0.020%), Vietnamese (78.0%, a difference of 0.070%), Immigrants from Belize (78.0%, a difference of 0.080%), and Spanish American (77.8%, a difference of 0.080%).
| Demographics | Rating | Rank | In Labor Force | Age 20-64 |
| Guyanese | 0.0 /100 | #281 | Tragic 78.1% |
| Immigrants | St. Vincent and the Grenadines | 0.0 /100 | #282 | Tragic 78.1% |
| Immigrants | Nonimmigrants | 0.0 /100 | #283 | Tragic 78.1% |
| Immigrants | Guyana | 0.0 /100 | #284 | Tragic 78.1% |
| Osage | 0.0 /100 | #285 | Tragic 78.0% |
| Immigrants | Belize | 0.0 /100 | #286 | Tragic 78.0% |
| Vietnamese | 0.0 /100 | #287 | Tragic 78.0% |
| Hmong | 0.0 /100 | #288 | Tragic 77.9% |
| Africans | 0.0 /100 | #289 | Tragic 77.9% |
| Immigrants | Bangladesh | 0.0 /100 | #290 | Tragic 77.9% |
| Spanish Americans | 0.0 /100 | #291 | Tragic 77.8% |
| Immigrants | Azores | 0.0 /100 | #292 | Tragic 77.8% |
| Delaware | 0.0 /100 | #293 | Tragic 77.8% |
| Immigrants | Central America | 0.0 /100 | #294 | Tragic 77.7% |
| Immigrants | Grenada | 0.0 /100 | #295 | Tragic 77.7% |
Demographics Similar to Czechs by In Labor Force | Age 20-64
In terms of in labor force | age 20-64, the demographic groups most similar to Czechs are Latvian (80.5%, a difference of 0.010%), Immigrants from Liberia (80.5%, a difference of 0.030%), Immigrants from Middle Africa (80.5%, a difference of 0.030%), Brazilian (80.5%, a difference of 0.040%), and Immigrants from Zimbabwe (80.5%, a difference of 0.040%).
| Demographics | Rating | Rank | In Labor Force | Age 20-64 |
| Paraguayans | 99.8 /100 | #36 | Exceptional 80.6% |
| Immigrants | Moldova | 99.8 /100 | #37 | Exceptional 80.6% |
| Ugandans | 99.8 /100 | #38 | Exceptional 80.6% |
| Brazilians | 99.8 /100 | #39 | Exceptional 80.5% |
| Immigrants | Zimbabwe | 99.8 /100 | #40 | Exceptional 80.5% |
| Immigrants | Liberia | 99.8 /100 | #41 | Exceptional 80.5% |
| Latvians | 99.8 /100 | #42 | Exceptional 80.5% |
| Czechs | 99.7 /100 | #43 | Exceptional 80.5% |
| Immigrants | Middle Africa | 99.7 /100 | #44 | Exceptional 80.5% |
| Slovenes | 99.7 /100 | #45 | Exceptional 80.5% |
| Immigrants | Pakistan | 99.6 /100 | #46 | Exceptional 80.5% |
| Immigrants | Africa | 99.6 /100 | #47 | Exceptional 80.4% |
| Immigrants | Hong Kong | 99.5 /100 | #48 | Exceptional 80.4% |
| Immigrants | Greece | 99.4 /100 | #49 | Exceptional 80.4% |
| Immigrants | Sudan | 99.4 /100 | #50 | Exceptional 80.4% |