Burmese vs Immigrants from Cuba In Labor Force | Age 20-64
COMPARE
Burmese
Immigrants from Cuba
In Labor Force | Age 20-64
In Labor Force | Age 20-64 Comparison
Burmese
Immigrants from Cuba
80.3%
IN LABOR FORCE | AGE 20-64
98.8/ 100
METRIC RATING
61st/ 347
METRIC RANK
79.7%
IN LABOR FORCE | AGE 20-64
66.7/ 100
METRIC RATING
159th/ 347
METRIC RANK
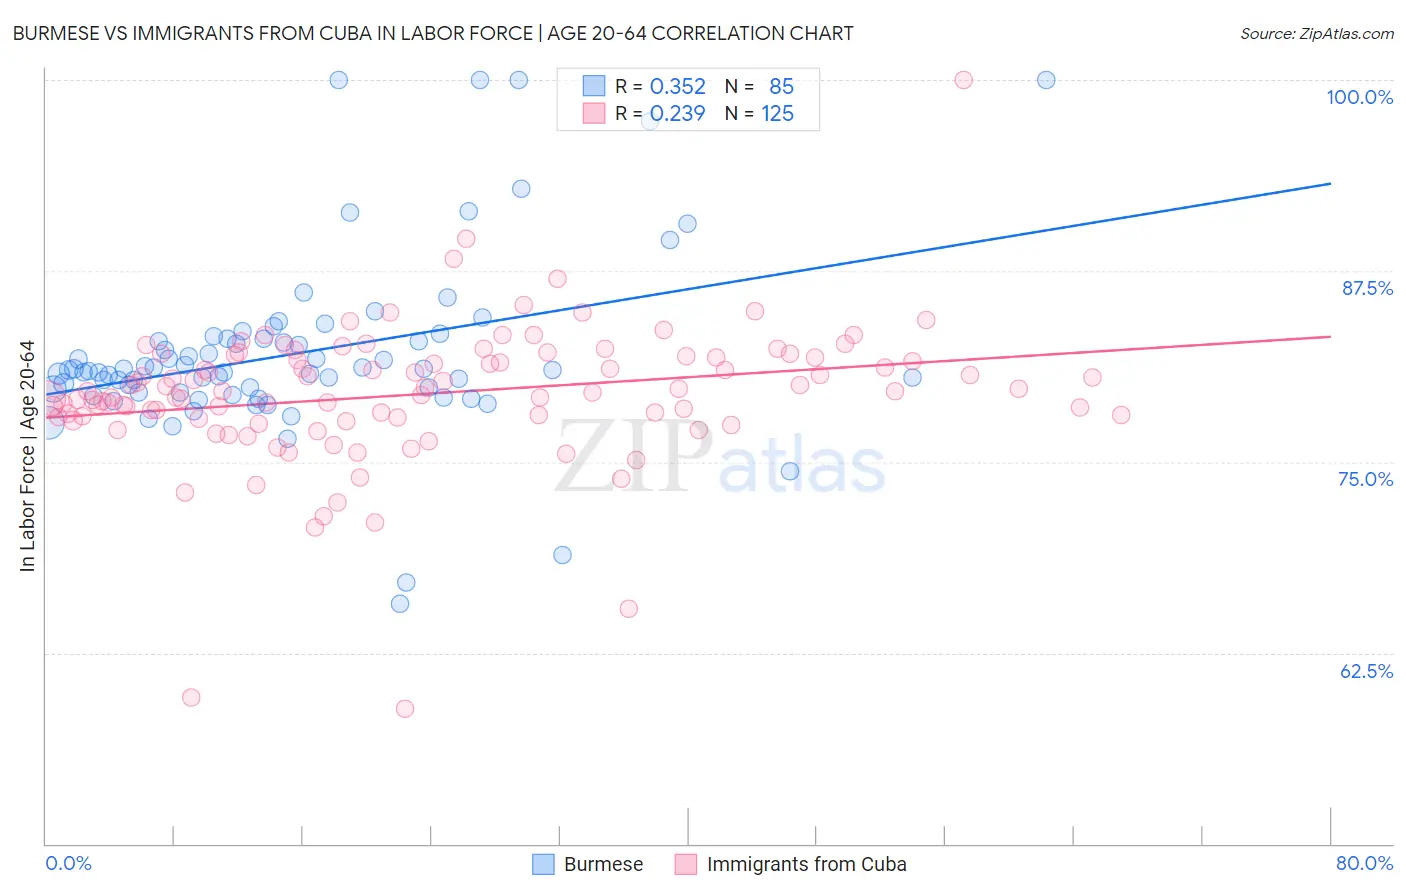
Burmese vs Immigrants from Cuba In Labor Force | Age 20-64 Correlation Chart
The statistical analysis conducted on geographies consisting of 465,432,233 people shows a mild positive correlation between the proportion of Burmese and labor force participation rate among population between the ages 20 and 64 in the United States with a correlation coefficient (R) of 0.352 and weighted average of 80.3%. Similarly, the statistical analysis conducted on geographies consisting of 326,009,980 people shows a weak positive correlation between the proportion of Immigrants from Cuba and labor force participation rate among population between the ages 20 and 64 in the United States with a correlation coefficient (R) of 0.239 and weighted average of 79.7%, a difference of 0.75%.
In Labor Force | Age 20-64 Correlation Summary
| Measurement | Burmese | Immigrants from Cuba |
| Minimum | 65.7% | 58.8% |
| Maximum | 100.0% | 100.0% |
| Range | 34.3% | 41.2% |
| Mean | 82.1% | 79.4% |
| Median | 81.0% | 79.6% |
| Interquartile 25% (IQ1) | 79.5% | 77.9% |
| Interquartile 75% (IQ3) | 83.1% | 81.9% |
| Interquartile Range (IQR) | 3.5% | 3.9% |
| Standard Deviation (Sample) | 6.0% | 4.7% |
| Standard Deviation (Population) | 6.0% | 4.7% |
Similar Demographics by In Labor Force | Age 20-64
Demographics Similar to Burmese by In Labor Force | Age 20-64
In terms of in labor force | age 20-64, the demographic groups most similar to Burmese are Tongan (80.3%, a difference of 0.0%), Carpatho Rusyn (80.3%, a difference of 0.0%), Serbian (80.3%, a difference of 0.010%), Swedish (80.3%, a difference of 0.010%), and Immigrants from Korea (80.3%, a difference of 0.010%).
| Demographics | Rating | Rank | In Labor Force | Age 20-64 |
| Peruvians | 99.1 /100 | #54 | Exceptional 80.3% |
| Immigrants | Cabo Verde | 99.0 /100 | #55 | Exceptional 80.3% |
| Immigrants | Northern Africa | 99.0 /100 | #56 | Exceptional 80.3% |
| Afghans | 98.9 /100 | #57 | Exceptional 80.3% |
| Serbians | 98.9 /100 | #58 | Exceptional 80.3% |
| Swedes | 98.9 /100 | #59 | Exceptional 80.3% |
| Tongans | 98.8 /100 | #60 | Exceptional 80.3% |
| Burmese | 98.8 /100 | #61 | Exceptional 80.3% |
| Carpatho Rusyns | 98.8 /100 | #62 | Exceptional 80.3% |
| Immigrants | Korea | 98.8 /100 | #63 | Exceptional 80.3% |
| Immigrants | Albania | 98.7 /100 | #64 | Exceptional 80.3% |
| Lithuanians | 98.7 /100 | #65 | Exceptional 80.2% |
| Macedonians | 98.7 /100 | #66 | Exceptional 80.2% |
| Taiwanese | 98.6 /100 | #67 | Exceptional 80.2% |
| Bhutanese | 98.6 /100 | #68 | Exceptional 80.2% |
Demographics Similar to Immigrants from Cuba by In Labor Force | Age 20-64
In terms of in labor force | age 20-64, the demographic groups most similar to Immigrants from Cuba are Moroccan (79.7%, a difference of 0.0%), South African (79.7%, a difference of 0.0%), Austrian (79.7%, a difference of 0.010%), German (79.7%, a difference of 0.010%), and New Zealander (79.7%, a difference of 0.020%).
| Demographics | Rating | Rank | In Labor Force | Age 20-64 |
| Immigrants | Northern Europe | 72.0 /100 | #152 | Good 79.7% |
| Immigrants | Kazakhstan | 69.5 /100 | #153 | Good 79.7% |
| New Zealanders | 69.4 /100 | #154 | Good 79.7% |
| Immigrants | South Africa | 69.2 /100 | #155 | Good 79.7% |
| Senegalese | 69.1 /100 | #156 | Good 79.7% |
| Immigrants | China | 69.1 /100 | #157 | Good 79.7% |
| Austrians | 67.6 /100 | #158 | Good 79.7% |
| Immigrants | Cuba | 66.7 /100 | #159 | Good 79.7% |
| Moroccans | 66.7 /100 | #160 | Good 79.7% |
| South Africans | 66.2 /100 | #161 | Good 79.7% |
| Germans | 65.2 /100 | #162 | Good 79.7% |
| Immigrants | Costa Rica | 64.6 /100 | #163 | Good 79.7% |
| Immigrants | Burma/Myanmar | 64.4 /100 | #164 | Good 79.7% |
| Nigerians | 64.0 /100 | #165 | Good 79.7% |
| Okinawans | 62.7 /100 | #166 | Good 79.6% |