Comanche vs Immigrants from Cuba In Labor Force | Age 20-64
COMPARE
Comanche
Immigrants from Cuba
In Labor Force | Age 20-64
In Labor Force | Age 20-64 Comparison
Comanche
Immigrants from Cuba
77.0%
IN LABOR FORCE | AGE 20-64
0.0/ 100
METRIC RATING
310th/ 347
METRIC RANK
79.7%
IN LABOR FORCE | AGE 20-64
66.7/ 100
METRIC RATING
159th/ 347
METRIC RANK
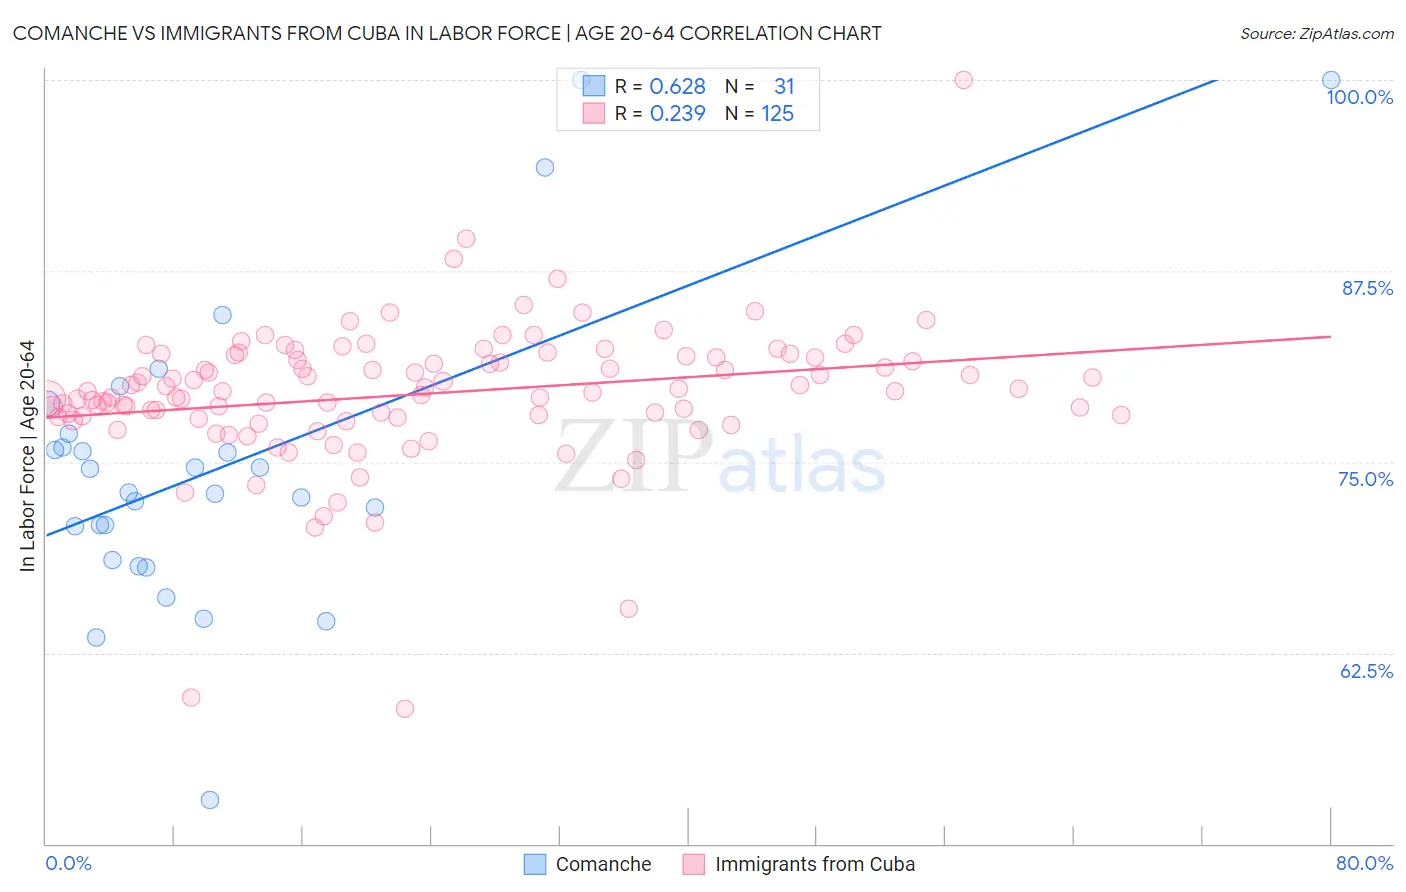
Comanche vs Immigrants from Cuba In Labor Force | Age 20-64 Correlation Chart
The statistical analysis conducted on geographies consisting of 109,783,732 people shows a significant positive correlation between the proportion of Comanche and labor force participation rate among population between the ages 20 and 64 in the United States with a correlation coefficient (R) of 0.628 and weighted average of 77.0%. Similarly, the statistical analysis conducted on geographies consisting of 326,009,980 people shows a weak positive correlation between the proportion of Immigrants from Cuba and labor force participation rate among population between the ages 20 and 64 in the United States with a correlation coefficient (R) of 0.239 and weighted average of 79.7%, a difference of 3.4%.
In Labor Force | Age 20-64 Correlation Summary
| Measurement | Comanche | Immigrants from Cuba |
| Minimum | 52.9% | 58.8% |
| Maximum | 100.0% | 100.0% |
| Range | 47.1% | 41.2% |
| Mean | 74.7% | 79.4% |
| Median | 73.0% | 79.6% |
| Interquartile 25% (IQ1) | 68.6% | 77.9% |
| Interquartile 75% (IQ3) | 76.8% | 81.9% |
| Interquartile Range (IQR) | 8.3% | 3.9% |
| Standard Deviation (Sample) | 9.9% | 4.7% |
| Standard Deviation (Population) | 9.7% | 4.7% |
Similar Demographics by In Labor Force | Age 20-64
Demographics Similar to Comanche by In Labor Force | Age 20-64
In terms of in labor force | age 20-64, the demographic groups most similar to Comanche are Alaska Native (77.0%, a difference of 0.020%), American (77.0%, a difference of 0.020%), Blackfeet (77.0%, a difference of 0.030%), Central American Indian (77.1%, a difference of 0.080%), and Alaskan Athabascan (76.9%, a difference of 0.21%).
| Demographics | Rating | Rank | In Labor Force | Age 20-64 |
| Chippewa | 0.0 /100 | #303 | Tragic 77.3% |
| Immigrants | Mexico | 0.0 /100 | #304 | Tragic 77.3% |
| Mexicans | 0.0 /100 | #305 | Tragic 77.2% |
| Potawatomi | 0.0 /100 | #306 | Tragic 77.2% |
| Central American Indians | 0.0 /100 | #307 | Tragic 77.1% |
| Alaska Natives | 0.0 /100 | #308 | Tragic 77.0% |
| Americans | 0.0 /100 | #309 | Tragic 77.0% |
| Comanche | 0.0 /100 | #310 | Tragic 77.0% |
| Blackfeet | 0.0 /100 | #311 | Tragic 77.0% |
| Alaskan Athabascans | 0.0 /100 | #312 | Tragic 76.9% |
| Shoshone | 0.0 /100 | #313 | Tragic 76.8% |
| Blacks/African Americans | 0.0 /100 | #314 | Tragic 76.8% |
| Ottawa | 0.0 /100 | #315 | Tragic 76.7% |
| Yaqui | 0.0 /100 | #316 | Tragic 76.5% |
| Cherokee | 0.0 /100 | #317 | Tragic 76.2% |
Demographics Similar to Immigrants from Cuba by In Labor Force | Age 20-64
In terms of in labor force | age 20-64, the demographic groups most similar to Immigrants from Cuba are Moroccan (79.7%, a difference of 0.0%), South African (79.7%, a difference of 0.0%), Austrian (79.7%, a difference of 0.010%), German (79.7%, a difference of 0.010%), and New Zealander (79.7%, a difference of 0.020%).
| Demographics | Rating | Rank | In Labor Force | Age 20-64 |
| Immigrants | Northern Europe | 72.0 /100 | #152 | Good 79.7% |
| Immigrants | Kazakhstan | 69.5 /100 | #153 | Good 79.7% |
| New Zealanders | 69.4 /100 | #154 | Good 79.7% |
| Immigrants | South Africa | 69.2 /100 | #155 | Good 79.7% |
| Senegalese | 69.1 /100 | #156 | Good 79.7% |
| Immigrants | China | 69.1 /100 | #157 | Good 79.7% |
| Austrians | 67.6 /100 | #158 | Good 79.7% |
| Immigrants | Cuba | 66.7 /100 | #159 | Good 79.7% |
| Moroccans | 66.7 /100 | #160 | Good 79.7% |
| South Africans | 66.2 /100 | #161 | Good 79.7% |
| Germans | 65.2 /100 | #162 | Good 79.7% |
| Immigrants | Costa Rica | 64.6 /100 | #163 | Good 79.7% |
| Immigrants | Burma/Myanmar | 64.4 /100 | #164 | Good 79.7% |
| Nigerians | 64.0 /100 | #165 | Good 79.7% |
| Okinawans | 62.7 /100 | #166 | Good 79.6% |