Hmong vs Immigrants from North Macedonia In Labor Force | Age 20-64
COMPARE
Hmong
Immigrants from North Macedonia
In Labor Force | Age 20-64
In Labor Force | Age 20-64 Comparison
Hmong
Immigrants from North Macedonia
77.9%
IN LABOR FORCE | AGE 20-64
0.0/ 100
METRIC RATING
288th/ 347
METRIC RANK
80.7%
IN LABOR FORCE | AGE 20-64
99.9/ 100
METRIC RATING
30th/ 347
METRIC RANK
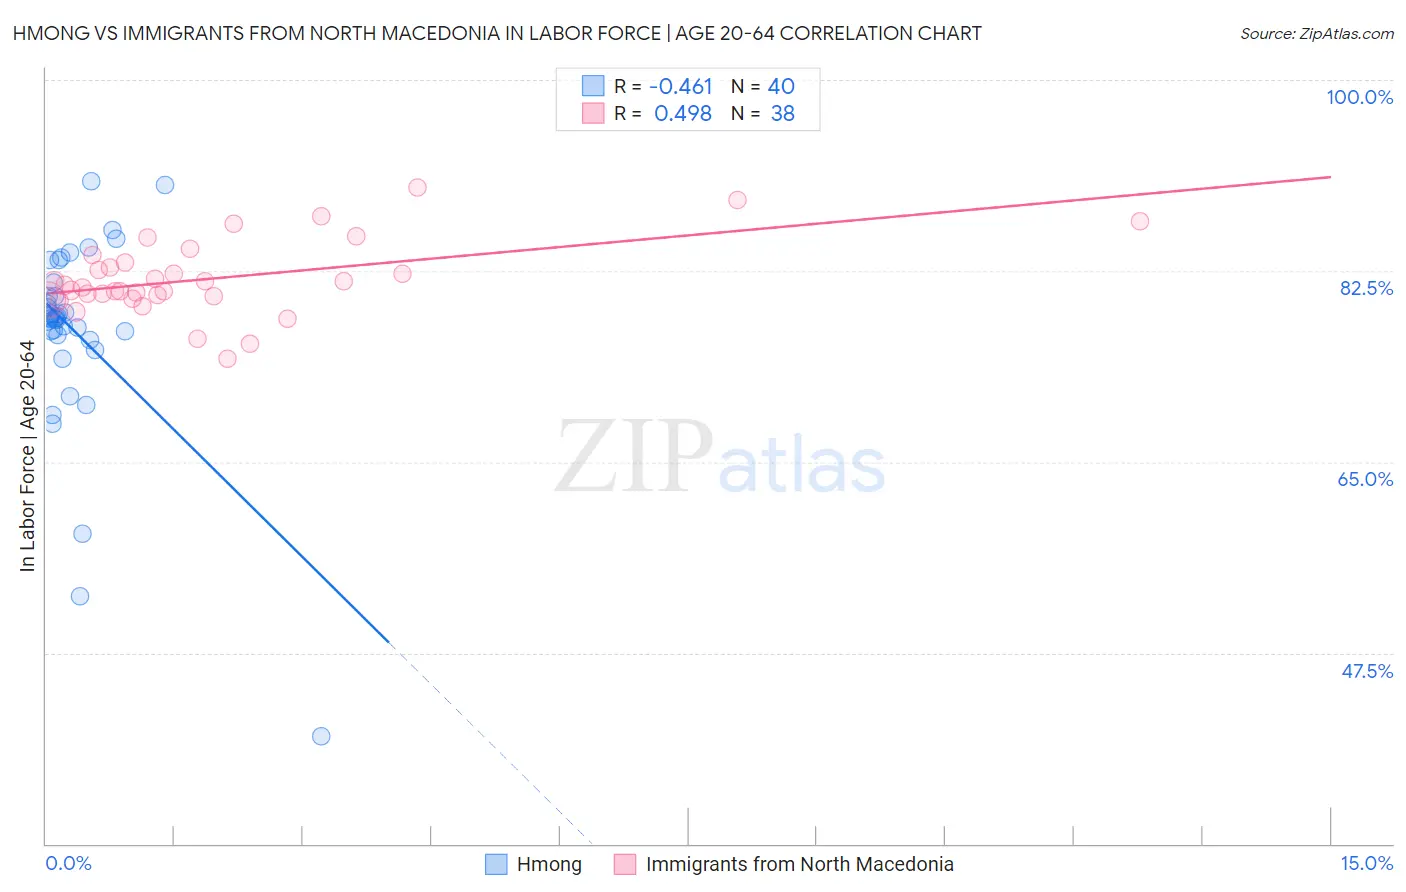
Hmong vs Immigrants from North Macedonia In Labor Force | Age 20-64 Correlation Chart
The statistical analysis conducted on geographies consisting of 24,681,537 people shows a moderate negative correlation between the proportion of Hmong and labor force participation rate among population between the ages 20 and 64 in the United States with a correlation coefficient (R) of -0.461 and weighted average of 77.9%. Similarly, the statistical analysis conducted on geographies consisting of 74,317,186 people shows a moderate positive correlation between the proportion of Immigrants from North Macedonia and labor force participation rate among population between the ages 20 and 64 in the United States with a correlation coefficient (R) of 0.498 and weighted average of 80.7%, a difference of 3.6%.
In Labor Force | Age 20-64 Correlation Summary
| Measurement | Hmong | Immigrants from North Macedonia |
| Minimum | 39.8% | 74.4% |
| Maximum | 90.7% | 90.1% |
| Range | 50.9% | 15.7% |
| Mean | 76.8% | 81.8% |
| Median | 78.2% | 81.1% |
| Interquartile 25% (IQ1) | 76.4% | 80.1% |
| Interquartile 75% (IQ3) | 80.8% | 83.2% |
| Interquartile Range (IQR) | 4.4% | 3.1% |
| Standard Deviation (Sample) | 9.3% | 3.4% |
| Standard Deviation (Population) | 9.2% | 3.4% |
Similar Demographics by In Labor Force | Age 20-64
Demographics Similar to Hmong by In Labor Force | Age 20-64
In terms of in labor force | age 20-64, the demographic groups most similar to Hmong are African (77.9%, a difference of 0.010%), Immigrants from Bangladesh (77.9%, a difference of 0.020%), Vietnamese (78.0%, a difference of 0.070%), Immigrants from Belize (78.0%, a difference of 0.080%), and Spanish American (77.8%, a difference of 0.080%).
| Demographics | Rating | Rank | In Labor Force | Age 20-64 |
| Guyanese | 0.0 /100 | #281 | Tragic 78.1% |
| Immigrants | St. Vincent and the Grenadines | 0.0 /100 | #282 | Tragic 78.1% |
| Immigrants | Nonimmigrants | 0.0 /100 | #283 | Tragic 78.1% |
| Immigrants | Guyana | 0.0 /100 | #284 | Tragic 78.1% |
| Osage | 0.0 /100 | #285 | Tragic 78.0% |
| Immigrants | Belize | 0.0 /100 | #286 | Tragic 78.0% |
| Vietnamese | 0.0 /100 | #287 | Tragic 78.0% |
| Hmong | 0.0 /100 | #288 | Tragic 77.9% |
| Africans | 0.0 /100 | #289 | Tragic 77.9% |
| Immigrants | Bangladesh | 0.0 /100 | #290 | Tragic 77.9% |
| Spanish Americans | 0.0 /100 | #291 | Tragic 77.8% |
| Immigrants | Azores | 0.0 /100 | #292 | Tragic 77.8% |
| Delaware | 0.0 /100 | #293 | Tragic 77.8% |
| Immigrants | Central America | 0.0 /100 | #294 | Tragic 77.7% |
| Immigrants | Grenada | 0.0 /100 | #295 | Tragic 77.7% |
Demographics Similar to Immigrants from North Macedonia by In Labor Force | Age 20-64
In terms of in labor force | age 20-64, the demographic groups most similar to Immigrants from North Macedonia are Immigrants from South Central Asia (80.7%, a difference of 0.010%), Immigrants from Uganda (80.7%, a difference of 0.020%), Immigrants from Lithuania (80.7%, a difference of 0.020%), Immigrants from Kenya (80.7%, a difference of 0.030%), and Immigrants from Ireland (80.7%, a difference of 0.030%).
| Demographics | Rating | Rank | In Labor Force | Age 20-64 |
| Immigrants | Bosnia and Herzegovina | 100.0 /100 | #23 | Exceptional 80.8% |
| Immigrants | Morocco | 100.0 /100 | #24 | Exceptional 80.8% |
| Kenyans | 100.0 /100 | #25 | Exceptional 80.8% |
| Immigrants | Serbia | 100.0 /100 | #26 | Exceptional 80.8% |
| Immigrants | Kenya | 99.9 /100 | #27 | Exceptional 80.7% |
| Immigrants | Uganda | 99.9 /100 | #28 | Exceptional 80.7% |
| Immigrants | South Central Asia | 99.9 /100 | #29 | Exceptional 80.7% |
| Immigrants | North Macedonia | 99.9 /100 | #30 | Exceptional 80.7% |
| Immigrants | Lithuania | 99.9 /100 | #31 | Exceptional 80.7% |
| Immigrants | Ireland | 99.9 /100 | #32 | Exceptional 80.7% |
| Chinese | 99.9 /100 | #33 | Exceptional 80.7% |
| Immigrants | Brazil | 99.9 /100 | #34 | Exceptional 80.7% |
| Immigrants | Poland | 99.9 /100 | #35 | Exceptional 80.6% |
| Paraguayans | 99.8 /100 | #36 | Exceptional 80.6% |
| Immigrants | Moldova | 99.8 /100 | #37 | Exceptional 80.6% |