Hmong vs Immigrants from Barbados In Labor Force | Age 20-64
COMPARE
Hmong
Immigrants from Barbados
In Labor Force | Age 20-64
In Labor Force | Age 20-64 Comparison
Hmong
Immigrants from Barbados
77.9%
IN LABOR FORCE | AGE 20-64
0.0/ 100
METRIC RATING
288th/ 347
METRIC RANK
78.3%
IN LABOR FORCE | AGE 20-64
0.0/ 100
METRIC RATING
269th/ 347
METRIC RANK
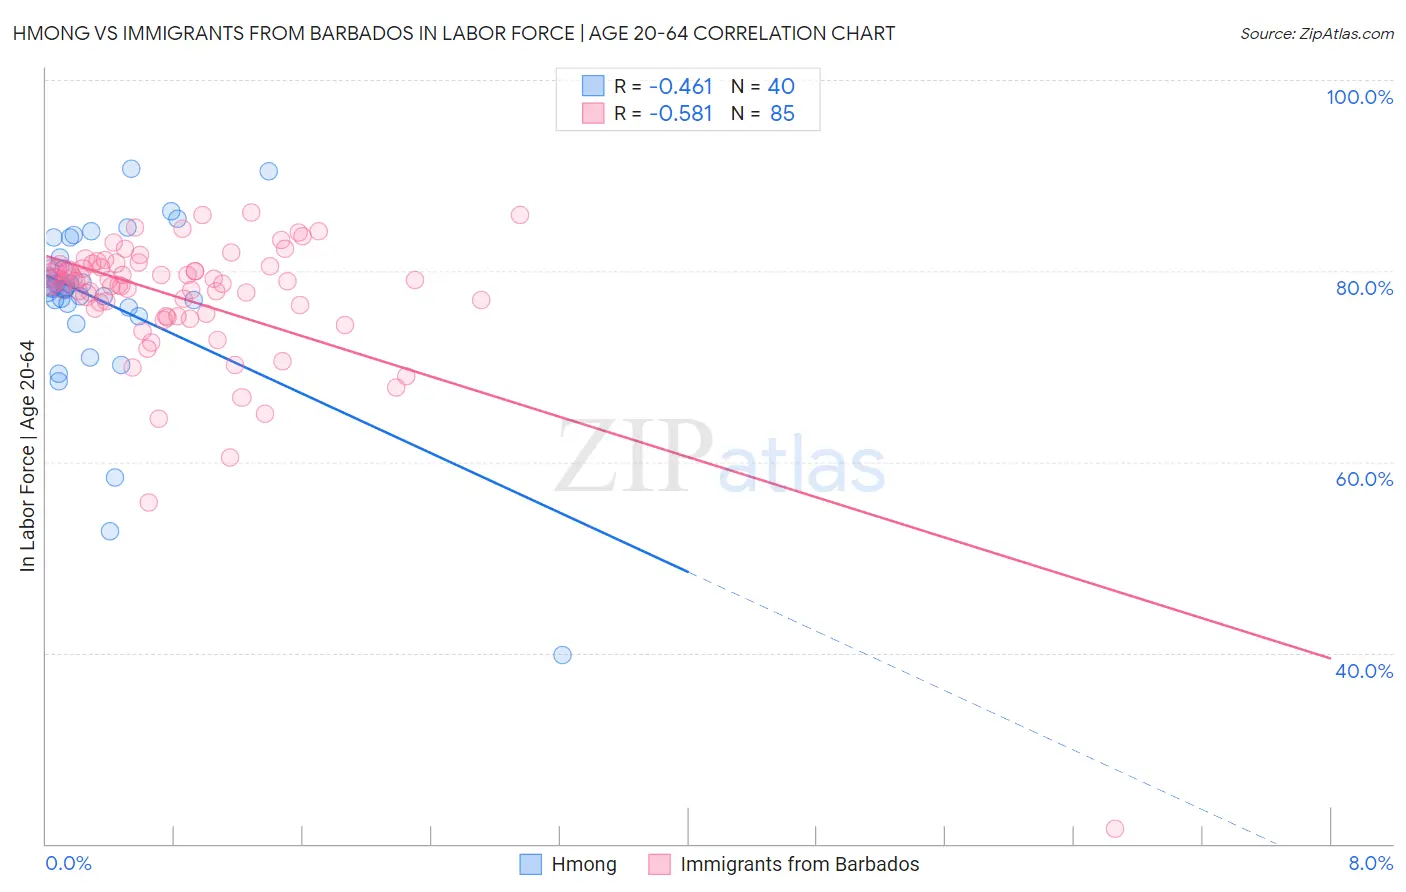
Hmong vs Immigrants from Barbados In Labor Force | Age 20-64 Correlation Chart
The statistical analysis conducted on geographies consisting of 24,681,537 people shows a moderate negative correlation between the proportion of Hmong and labor force participation rate among population between the ages 20 and 64 in the United States with a correlation coefficient (R) of -0.461 and weighted average of 77.9%. Similarly, the statistical analysis conducted on geographies consisting of 112,778,506 people shows a substantial negative correlation between the proportion of Immigrants from Barbados and labor force participation rate among population between the ages 20 and 64 in the United States with a correlation coefficient (R) of -0.581 and weighted average of 78.3%, a difference of 0.50%.
In Labor Force | Age 20-64 Correlation Summary
| Measurement | Hmong | Immigrants from Barbados |
| Minimum | 39.8% | 21.6% |
| Maximum | 90.7% | 86.1% |
| Range | 50.9% | 64.5% |
| Mean | 76.8% | 77.0% |
| Median | 78.2% | 78.9% |
| Interquartile 25% (IQ1) | 76.4% | 75.4% |
| Interquartile 75% (IQ3) | 80.8% | 80.5% |
| Interquartile Range (IQR) | 4.4% | 5.1% |
| Standard Deviation (Sample) | 9.3% | 8.1% |
| Standard Deviation (Population) | 9.2% | 8.1% |
Demographics Similar to Hmong and Immigrants from Barbados by In Labor Force | Age 20-64
In terms of in labor force | age 20-64, the demographic groups most similar to Hmong are Vietnamese (78.0%, a difference of 0.070%), Immigrants from Belize (78.0%, a difference of 0.080%), Osage (78.0%, a difference of 0.090%), Immigrants from Guyana (78.1%, a difference of 0.19%), and Nonimmigrants (78.1%, a difference of 0.20%). Similarly, the demographic groups most similar to Immigrants from Barbados are Scotch-Irish (78.3%, a difference of 0.020%), Immigrants from Latin America (78.3%, a difference of 0.040%), Marshallese (78.3%, a difference of 0.040%), West Indian (78.3%, a difference of 0.050%), and French American Indian (78.2%, a difference of 0.090%).
| Demographics | Rating | Rank | In Labor Force | Age 20-64 |
| West Indians | 0.0 /100 | #268 | Tragic 78.3% |
| Immigrants | Barbados | 0.0 /100 | #269 | Tragic 78.3% |
| Scotch-Irish | 0.0 /100 | #270 | Tragic 78.3% |
| Immigrants | Latin America | 0.0 /100 | #271 | Tragic 78.3% |
| Marshallese | 0.0 /100 | #272 | Tragic 78.3% |
| French American Indians | 0.0 /100 | #273 | Tragic 78.2% |
| Aleuts | 0.0 /100 | #274 | Tragic 78.2% |
| Spanish | 0.0 /100 | #275 | Tragic 78.2% |
| Puget Sound Salish | 0.0 /100 | #276 | Tragic 78.2% |
| Immigrants | Bahamas | 0.0 /100 | #277 | Tragic 78.2% |
| Mexican American Indians | 0.0 /100 | #278 | Tragic 78.2% |
| Belizeans | 0.0 /100 | #279 | Tragic 78.2% |
| Immigrants | Dominica | 0.0 /100 | #280 | Tragic 78.1% |
| Guyanese | 0.0 /100 | #281 | Tragic 78.1% |
| Immigrants | St. Vincent and the Grenadines | 0.0 /100 | #282 | Tragic 78.1% |
| Immigrants | Nonimmigrants | 0.0 /100 | #283 | Tragic 78.1% |
| Immigrants | Guyana | 0.0 /100 | #284 | Tragic 78.1% |
| Osage | 0.0 /100 | #285 | Tragic 78.0% |
| Immigrants | Belize | 0.0 /100 | #286 | Tragic 78.0% |
| Vietnamese | 0.0 /100 | #287 | Tragic 78.0% |
| Hmong | 0.0 /100 | #288 | Tragic 77.9% |