Hmong vs Immigrants from Canada In Labor Force | Age 16-19
COMPARE
Hmong
Immigrants from Canada
In Labor Force | Age 16-19
In Labor Force | Age 16-19 Comparison
Hmong
Immigrants from Canada
38.7%
IN LABOR FORCE | AGE 16-19
99.1/ 100
METRIC RATING
101st/ 347
METRIC RANK
38.9%
IN LABOR FORCE | AGE 16-19
99.4/ 100
METRIC RATING
94th/ 347
METRIC RANK
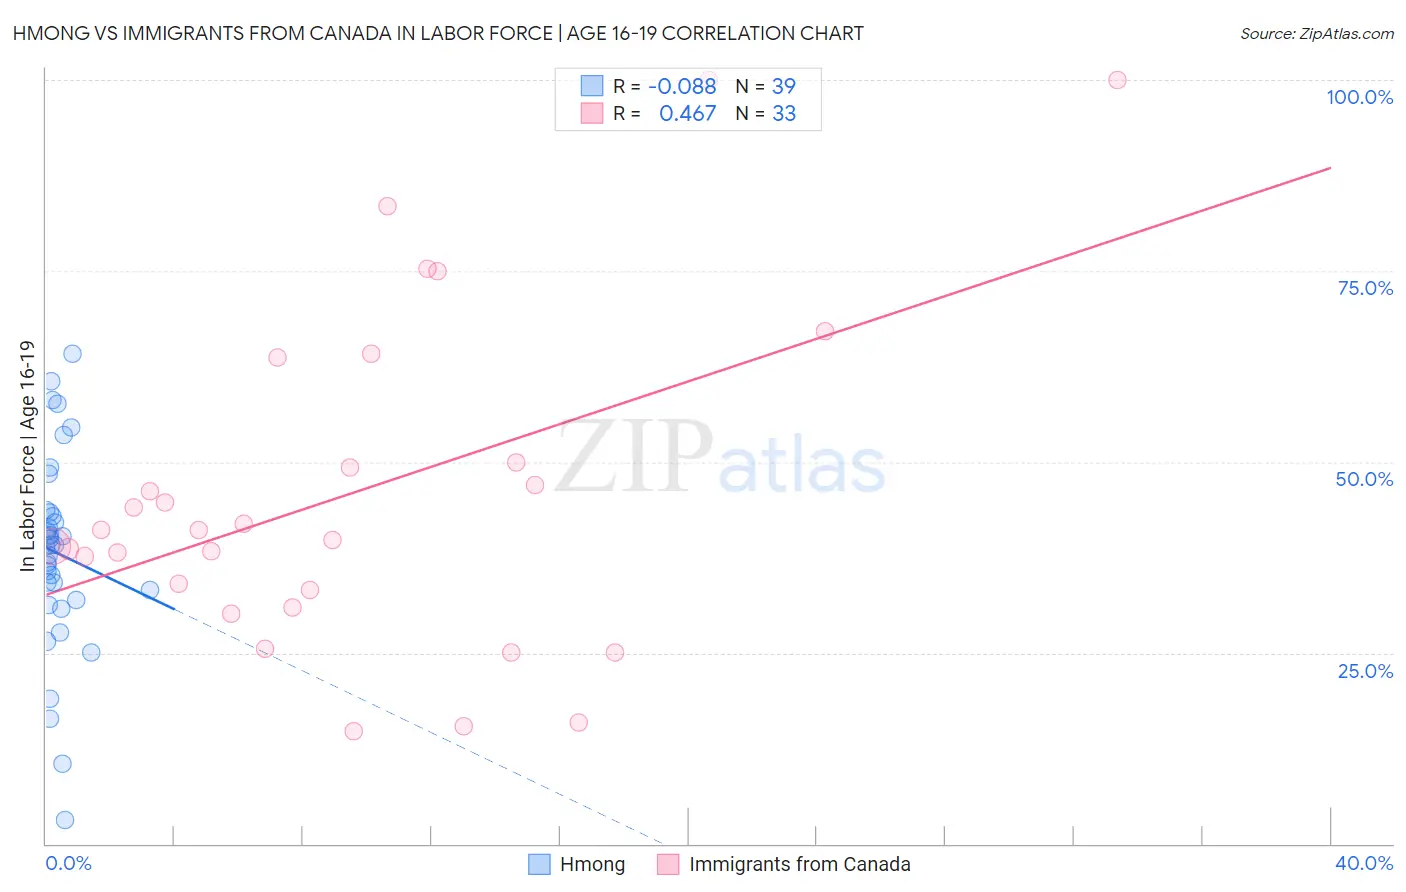
Hmong vs Immigrants from Canada In Labor Force | Age 16-19 Correlation Chart
The statistical analysis conducted on geographies consisting of 24,681,034 people shows a slight negative correlation between the proportion of Hmong and labor force participation rate among population between the ages 16 and 19 in the United States with a correlation coefficient (R) of -0.088 and weighted average of 38.7%. Similarly, the statistical analysis conducted on geographies consisting of 458,098,188 people shows a moderate positive correlation between the proportion of Immigrants from Canada and labor force participation rate among population between the ages 16 and 19 in the United States with a correlation coefficient (R) of 0.467 and weighted average of 38.9%, a difference of 0.55%.
In Labor Force | Age 16-19 Correlation Summary
| Measurement | Hmong | Immigrants from Canada |
| Minimum | 3.1% | 14.7% |
| Maximum | 64.2% | 100.0% |
| Range | 61.1% | 85.3% |
| Mean | 38.1% | 45.9% |
| Median | 39.1% | 41.0% |
| Interquartile 25% (IQ1) | 31.9% | 32.1% |
| Interquartile 75% (IQ3) | 43.4% | 56.8% |
| Interquartile Range (IQR) | 11.5% | 24.7% |
| Standard Deviation (Sample) | 12.9% | 21.9% |
| Standard Deviation (Population) | 12.7% | 21.6% |
Demographics Similar to Hmong and Immigrants from Canada by In Labor Force | Age 16-19
In terms of in labor force | age 16-19, the demographic groups most similar to Hmong are Zimbabwean (38.7%, a difference of 0.010%), Immigrants from Cameroon (38.7%, a difference of 0.040%), Immigrants from Thailand (38.7%, a difference of 0.070%), Immigrants from Eritrea (38.7%, a difference of 0.090%), and Iraqi (38.6%, a difference of 0.25%). Similarly, the demographic groups most similar to Immigrants from Canada are Blackfeet (38.9%, a difference of 0.010%), Osage (39.0%, a difference of 0.060%), Immigrants from North America (38.9%, a difference of 0.090%), Latvian (38.9%, a difference of 0.12%), and Spanish American (39.0%, a difference of 0.15%).
| Demographics | Rating | Rank | In Labor Force | Age 16-19 |
| Immigrants | Germany | 99.6 /100 | #87 | Exceptional 39.1% |
| Puget Sound Salish | 99.6 /100 | #88 | Exceptional 39.1% |
| Alaska Natives | 99.6 /100 | #89 | Exceptional 39.1% |
| Immigrants | Burma/Myanmar | 99.5 /100 | #90 | Exceptional 39.0% |
| Spanish Americans | 99.5 /100 | #91 | Exceptional 39.0% |
| Osage | 99.4 /100 | #92 | Exceptional 39.0% |
| Blackfeet | 99.4 /100 | #93 | Exceptional 38.9% |
| Immigrants | Canada | 99.4 /100 | #94 | Exceptional 38.9% |
| Immigrants | North America | 99.4 /100 | #95 | Exceptional 38.9% |
| Latvians | 99.4 /100 | #96 | Exceptional 38.9% |
| Greeks | 99.3 /100 | #97 | Exceptional 38.9% |
| Ugandans | 99.3 /100 | #98 | Exceptional 38.9% |
| Immigrants | North Macedonia | 99.3 /100 | #99 | Exceptional 38.9% |
| Immigrants | Thailand | 99.1 /100 | #100 | Exceptional 38.7% |
| Hmong | 99.1 /100 | #101 | Exceptional 38.7% |
| Zimbabweans | 99.1 /100 | #102 | Exceptional 38.7% |
| Immigrants | Cameroon | 99.0 /100 | #103 | Exceptional 38.7% |
| Immigrants | Eritrea | 99.0 /100 | #104 | Exceptional 38.7% |
| Iraqis | 98.9 /100 | #105 | Exceptional 38.6% |
| Delaware | 98.8 /100 | #106 | Exceptional 38.6% |
| Chinese | 98.8 /100 | #107 | Exceptional 38.6% |