Immigrants from Turkey vs Immigrants from Canada In Labor Force | Age 16-19
COMPARE
Immigrants from Turkey
Immigrants from Canada
In Labor Force | Age 16-19
In Labor Force | Age 16-19 Comparison
Immigrants from Turkey
Immigrants from Canada
34.9%
IN LABOR FORCE | AGE 16-19
2.6/ 100
METRIC RATING
244th/ 347
METRIC RANK
38.9%
IN LABOR FORCE | AGE 16-19
99.4/ 100
METRIC RATING
94th/ 347
METRIC RANK
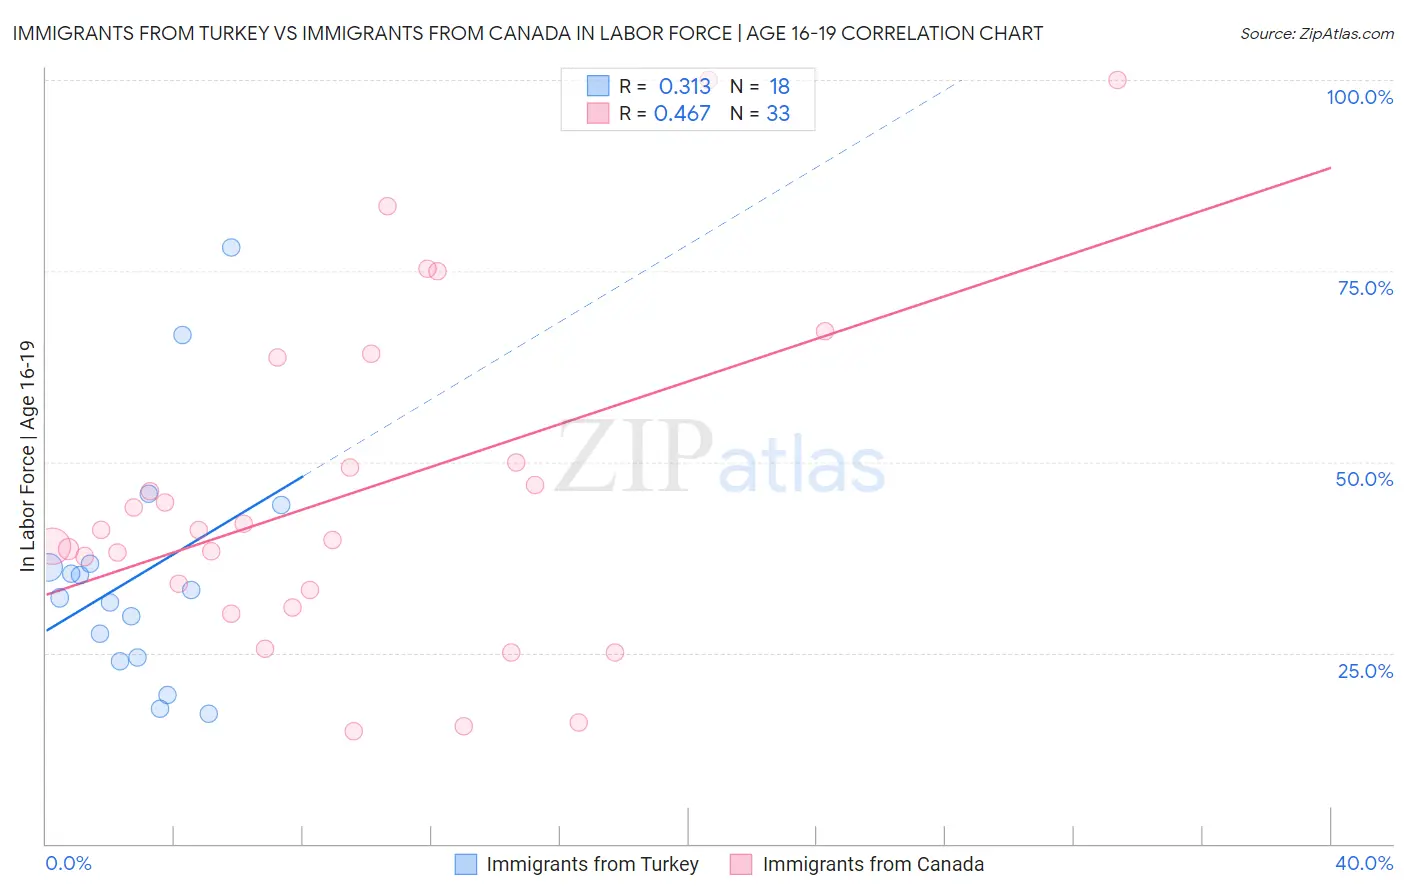
Immigrants from Turkey vs Immigrants from Canada In Labor Force | Age 16-19 Correlation Chart
The statistical analysis conducted on geographies consisting of 222,808,071 people shows a mild positive correlation between the proportion of Immigrants from Turkey and labor force participation rate among population between the ages 16 and 19 in the United States with a correlation coefficient (R) of 0.313 and weighted average of 34.9%. Similarly, the statistical analysis conducted on geographies consisting of 458,098,188 people shows a moderate positive correlation between the proportion of Immigrants from Canada and labor force participation rate among population between the ages 16 and 19 in the United States with a correlation coefficient (R) of 0.467 and weighted average of 38.9%, a difference of 11.6%.
In Labor Force | Age 16-19 Correlation Summary
| Measurement | Immigrants from Turkey | Immigrants from Canada |
| Minimum | 17.1% | 14.7% |
| Maximum | 78.1% | 100.0% |
| Range | 61.0% | 85.3% |
| Mean | 35.3% | 45.9% |
| Median | 32.8% | 41.0% |
| Interquartile 25% (IQ1) | 24.3% | 32.1% |
| Interquartile 75% (IQ3) | 36.6% | 56.8% |
| Interquartile Range (IQR) | 12.3% | 24.7% |
| Standard Deviation (Sample) | 15.8% | 21.9% |
| Standard Deviation (Population) | 15.4% | 21.6% |
Similar Demographics by In Labor Force | Age 16-19
Demographics Similar to Immigrants from Turkey by In Labor Force | Age 16-19
In terms of in labor force | age 16-19, the demographic groups most similar to Immigrants from Turkey are Pueblo (34.9%, a difference of 0.020%), Uruguayan (34.9%, a difference of 0.050%), Immigrants from Greece (34.9%, a difference of 0.060%), Immigrants from Sri Lanka (34.9%, a difference of 0.080%), and Laotian (34.9%, a difference of 0.090%).
| Demographics | Rating | Rank | In Labor Force | Age 16-19 |
| Immigrants | India | 3.5 /100 | #237 | Tragic 35.0% |
| Immigrants | Vietnam | 3.4 /100 | #238 | Tragic 35.0% |
| Inupiat | 3.2 /100 | #239 | Tragic 35.0% |
| Immigrants | Central America | 3.0 /100 | #240 | Tragic 35.0% |
| Immigrants | Ireland | 2.9 /100 | #241 | Tragic 35.0% |
| Uruguayans | 2.6 /100 | #242 | Tragic 34.9% |
| Pueblo | 2.6 /100 | #243 | Tragic 34.9% |
| Immigrants | Turkey | 2.6 /100 | #244 | Tragic 34.9% |
| Immigrants | Greece | 2.4 /100 | #245 | Tragic 34.9% |
| Immigrants | Sri Lanka | 2.4 /100 | #246 | Tragic 34.9% |
| Laotians | 2.4 /100 | #247 | Tragic 34.9% |
| Central Americans | 2.2 /100 | #248 | Tragic 34.8% |
| Immigrants | Ukraine | 2.2 /100 | #249 | Tragic 34.8% |
| Immigrants | Pakistan | 2.0 /100 | #250 | Tragic 34.8% |
| Immigrants | Western Asia | 2.0 /100 | #251 | Tragic 34.8% |
Demographics Similar to Immigrants from Canada by In Labor Force | Age 16-19
In terms of in labor force | age 16-19, the demographic groups most similar to Immigrants from Canada are Blackfeet (38.9%, a difference of 0.010%), Osage (39.0%, a difference of 0.060%), Immigrants from North America (38.9%, a difference of 0.090%), Latvian (38.9%, a difference of 0.12%), and Spanish American (39.0%, a difference of 0.15%).
| Demographics | Rating | Rank | In Labor Force | Age 16-19 |
| Immigrants | Germany | 99.6 /100 | #87 | Exceptional 39.1% |
| Puget Sound Salish | 99.6 /100 | #88 | Exceptional 39.1% |
| Alaska Natives | 99.6 /100 | #89 | Exceptional 39.1% |
| Immigrants | Burma/Myanmar | 99.5 /100 | #90 | Exceptional 39.0% |
| Spanish Americans | 99.5 /100 | #91 | Exceptional 39.0% |
| Osage | 99.4 /100 | #92 | Exceptional 39.0% |
| Blackfeet | 99.4 /100 | #93 | Exceptional 38.9% |
| Immigrants | Canada | 99.4 /100 | #94 | Exceptional 38.9% |
| Immigrants | North America | 99.4 /100 | #95 | Exceptional 38.9% |
| Latvians | 99.4 /100 | #96 | Exceptional 38.9% |
| Greeks | 99.3 /100 | #97 | Exceptional 38.9% |
| Ugandans | 99.3 /100 | #98 | Exceptional 38.9% |
| Immigrants | North Macedonia | 99.3 /100 | #99 | Exceptional 38.9% |
| Immigrants | Thailand | 99.1 /100 | #100 | Exceptional 38.7% |
| Hmong | 99.1 /100 | #101 | Exceptional 38.7% |