Immigrants from Bulgaria vs Immigrants from Canada In Labor Force | Age 16-19
COMPARE
Immigrants from Bulgaria
Immigrants from Canada
In Labor Force | Age 16-19
In Labor Force | Age 16-19 Comparison
Immigrants from Bulgaria
Immigrants from Canada
37.3%
IN LABOR FORCE | AGE 16-19
81.6/ 100
METRIC RATING
154th/ 347
METRIC RANK
38.9%
IN LABOR FORCE | AGE 16-19
99.4/ 100
METRIC RATING
94th/ 347
METRIC RANK
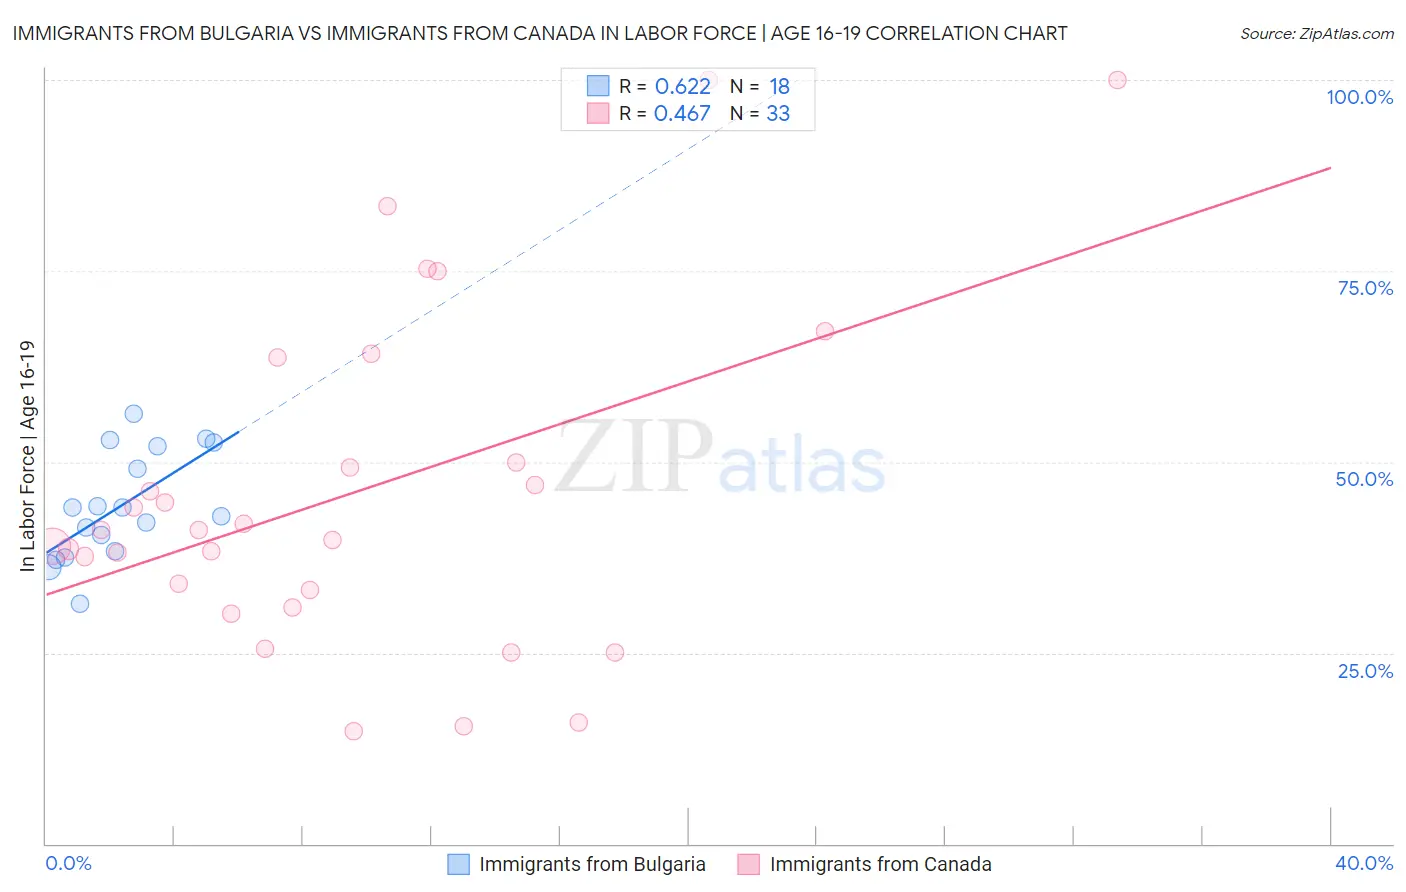
Immigrants from Bulgaria vs Immigrants from Canada In Labor Force | Age 16-19 Correlation Chart
The statistical analysis conducted on geographies consisting of 172,373,837 people shows a significant positive correlation between the proportion of Immigrants from Bulgaria and labor force participation rate among population between the ages 16 and 19 in the United States with a correlation coefficient (R) of 0.622 and weighted average of 37.3%. Similarly, the statistical analysis conducted on geographies consisting of 458,098,188 people shows a moderate positive correlation between the proportion of Immigrants from Canada and labor force participation rate among population between the ages 16 and 19 in the United States with a correlation coefficient (R) of 0.467 and weighted average of 38.9%, a difference of 4.5%.
In Labor Force | Age 16-19 Correlation Summary
| Measurement | Immigrants from Bulgaria | Immigrants from Canada |
| Minimum | 31.4% | 14.7% |
| Maximum | 56.3% | 100.0% |
| Range | 24.8% | 85.3% |
| Mean | 44.2% | 45.9% |
| Median | 43.5% | 41.0% |
| Interquartile 25% (IQ1) | 38.4% | 32.1% |
| Interquartile 75% (IQ3) | 52.0% | 56.8% |
| Interquartile Range (IQR) | 13.6% | 24.7% |
| Standard Deviation (Sample) | 7.0% | 21.9% |
| Standard Deviation (Population) | 6.8% | 21.6% |
Similar Demographics by In Labor Force | Age 16-19
Demographics Similar to Immigrants from Bulgaria by In Labor Force | Age 16-19
In terms of in labor force | age 16-19, the demographic groups most similar to Immigrants from Bulgaria are Arapaho (37.3%, a difference of 0.020%), Immigrants from Lithuania (37.2%, a difference of 0.070%), Kiowa (37.2%, a difference of 0.10%), Immigrants from Sierra Leone (37.3%, a difference of 0.17%), and Immigrants from Poland (37.3%, a difference of 0.25%).
| Demographics | Rating | Rank | In Labor Force | Age 16-19 |
| Brazilians | 88.7 /100 | #147 | Excellent 37.5% |
| Romanians | 87.3 /100 | #148 | Excellent 37.5% |
| Native Hawaiians | 85.0 /100 | #149 | Excellent 37.4% |
| Tsimshian | 84.7 /100 | #150 | Excellent 37.4% |
| Immigrants | Poland | 84.4 /100 | #151 | Excellent 37.3% |
| Immigrants | Sierra Leone | 83.6 /100 | #152 | Excellent 37.3% |
| Arapaho | 81.8 /100 | #153 | Excellent 37.3% |
| Immigrants | Bulgaria | 81.6 /100 | #154 | Excellent 37.3% |
| Immigrants | Lithuania | 80.7 /100 | #155 | Excellent 37.2% |
| Kiowa | 80.4 /100 | #156 | Excellent 37.2% |
| Immigrants | Brazil | 76.5 /100 | #157 | Good 37.1% |
| Ute | 75.7 /100 | #158 | Good 37.1% |
| Yaqui | 74.4 /100 | #159 | Good 37.1% |
| Immigrants | Saudi Arabia | 73.9 /100 | #160 | Good 37.0% |
| Cambodians | 71.5 /100 | #161 | Good 37.0% |
Demographics Similar to Immigrants from Canada by In Labor Force | Age 16-19
In terms of in labor force | age 16-19, the demographic groups most similar to Immigrants from Canada are Blackfeet (38.9%, a difference of 0.010%), Osage (39.0%, a difference of 0.060%), Immigrants from North America (38.9%, a difference of 0.090%), Latvian (38.9%, a difference of 0.12%), and Spanish American (39.0%, a difference of 0.15%).
| Demographics | Rating | Rank | In Labor Force | Age 16-19 |
| Immigrants | Germany | 99.6 /100 | #87 | Exceptional 39.1% |
| Puget Sound Salish | 99.6 /100 | #88 | Exceptional 39.1% |
| Alaska Natives | 99.6 /100 | #89 | Exceptional 39.1% |
| Immigrants | Burma/Myanmar | 99.5 /100 | #90 | Exceptional 39.0% |
| Spanish Americans | 99.5 /100 | #91 | Exceptional 39.0% |
| Osage | 99.4 /100 | #92 | Exceptional 39.0% |
| Blackfeet | 99.4 /100 | #93 | Exceptional 38.9% |
| Immigrants | Canada | 99.4 /100 | #94 | Exceptional 38.9% |
| Immigrants | North America | 99.4 /100 | #95 | Exceptional 38.9% |
| Latvians | 99.4 /100 | #96 | Exceptional 38.9% |
| Greeks | 99.3 /100 | #97 | Exceptional 38.9% |
| Ugandans | 99.3 /100 | #98 | Exceptional 38.9% |
| Immigrants | North Macedonia | 99.3 /100 | #99 | Exceptional 38.9% |
| Immigrants | Thailand | 99.1 /100 | #100 | Exceptional 38.7% |
| Hmong | 99.1 /100 | #101 | Exceptional 38.7% |