Hmong vs Lumbee In Labor Force | Age 16-19
COMPARE
Hmong
Lumbee
In Labor Force | Age 16-19
In Labor Force | Age 16-19 Comparison
Hmong
Lumbee
38.7%
IN LABOR FORCE | AGE 16-19
99.1/ 100
METRIC RATING
101st/ 347
METRIC RANK
31.0%
IN LABOR FORCE | AGE 16-19
0.0/ 100
METRIC RATING
330th/ 347
METRIC RANK
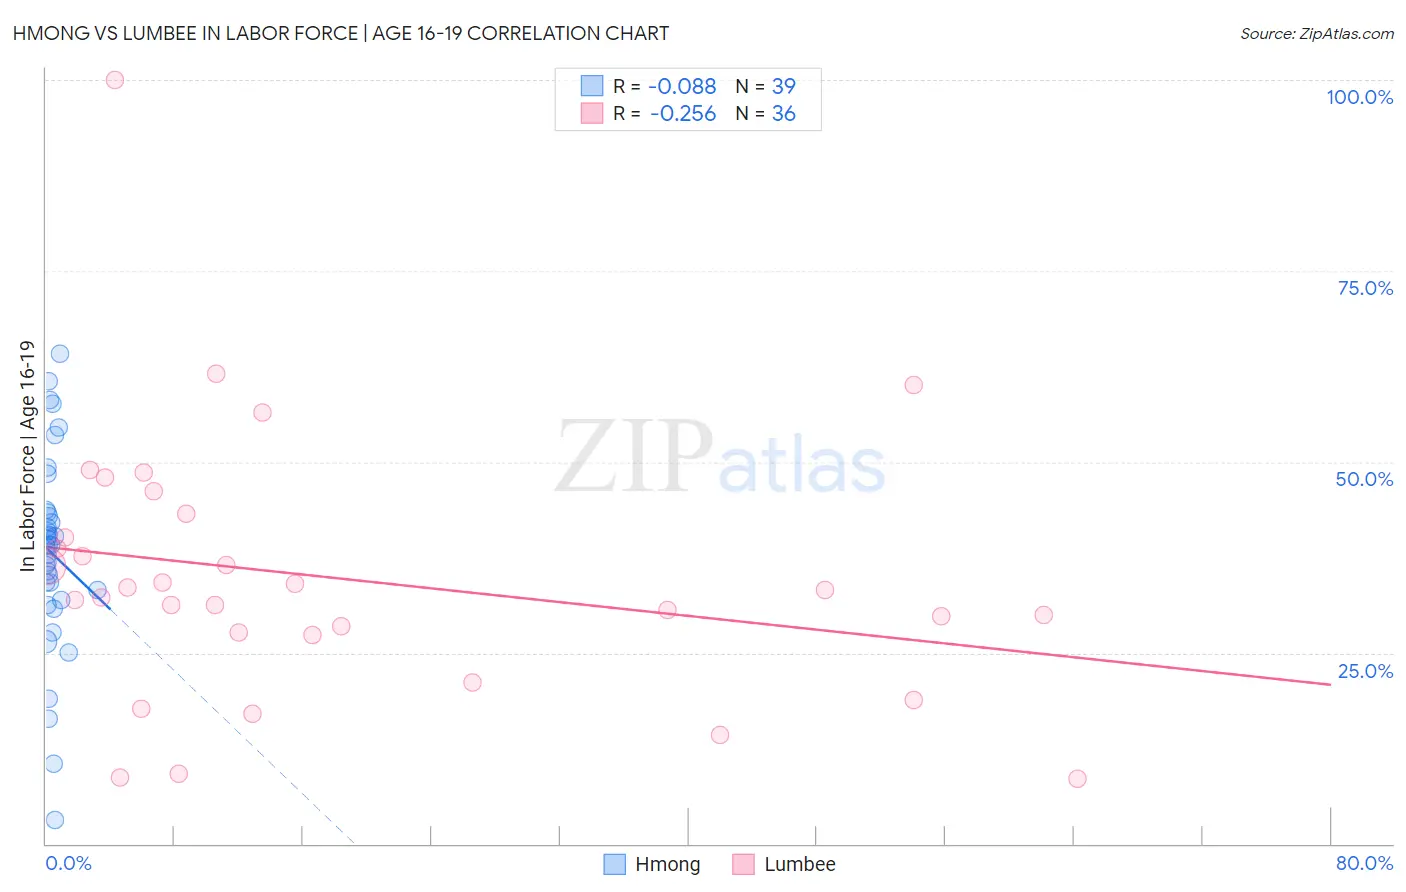
Hmong vs Lumbee In Labor Force | Age 16-19 Correlation Chart
The statistical analysis conducted on geographies consisting of 24,681,034 people shows a slight negative correlation between the proportion of Hmong and labor force participation rate among population between the ages 16 and 19 in the United States with a correlation coefficient (R) of -0.088 and weighted average of 38.7%. Similarly, the statistical analysis conducted on geographies consisting of 92,241,195 people shows a weak negative correlation between the proportion of Lumbee and labor force participation rate among population between the ages 16 and 19 in the United States with a correlation coefficient (R) of -0.256 and weighted average of 31.0%, a difference of 25.0%.
In Labor Force | Age 16-19 Correlation Summary
| Measurement | Hmong | Lumbee |
| Minimum | 3.1% | 8.5% |
| Maximum | 64.2% | 100.0% |
| Range | 61.1% | 91.5% |
| Mean | 38.1% | 34.8% |
| Median | 39.1% | 32.7% |
| Interquartile 25% (IQ1) | 31.9% | 27.5% |
| Interquartile 75% (IQ3) | 43.4% | 41.7% |
| Interquartile Range (IQR) | 11.5% | 14.2% |
| Standard Deviation (Sample) | 12.9% | 17.4% |
| Standard Deviation (Population) | 12.7% | 17.2% |
Similar Demographics by In Labor Force | Age 16-19
Demographics Similar to Hmong by In Labor Force | Age 16-19
In terms of in labor force | age 16-19, the demographic groups most similar to Hmong are Zimbabwean (38.7%, a difference of 0.010%), Immigrants from Cameroon (38.7%, a difference of 0.040%), Immigrants from Thailand (38.7%, a difference of 0.070%), Immigrants from Eritrea (38.7%, a difference of 0.090%), and Iraqi (38.6%, a difference of 0.25%).
| Demographics | Rating | Rank | In Labor Force | Age 16-19 |
| Immigrants | Canada | 99.4 /100 | #94 | Exceptional 38.9% |
| Immigrants | North America | 99.4 /100 | #95 | Exceptional 38.9% |
| Latvians | 99.4 /100 | #96 | Exceptional 38.9% |
| Greeks | 99.3 /100 | #97 | Exceptional 38.9% |
| Ugandans | 99.3 /100 | #98 | Exceptional 38.9% |
| Immigrants | North Macedonia | 99.3 /100 | #99 | Exceptional 38.9% |
| Immigrants | Thailand | 99.1 /100 | #100 | Exceptional 38.7% |
| Hmong | 99.1 /100 | #101 | Exceptional 38.7% |
| Zimbabweans | 99.1 /100 | #102 | Exceptional 38.7% |
| Immigrants | Cameroon | 99.0 /100 | #103 | Exceptional 38.7% |
| Immigrants | Eritrea | 99.0 /100 | #104 | Exceptional 38.7% |
| Iraqis | 98.9 /100 | #105 | Exceptional 38.6% |
| Delaware | 98.8 /100 | #106 | Exceptional 38.6% |
| Chinese | 98.8 /100 | #107 | Exceptional 38.6% |
| Immigrants | Ethiopia | 98.7 /100 | #108 | Exceptional 38.6% |
Demographics Similar to Lumbee by In Labor Force | Age 16-19
In terms of in labor force | age 16-19, the demographic groups most similar to Lumbee are Barbadian (31.0%, a difference of 0.12%), Immigrants from Ecuador (31.0%, a difference of 0.15%), Trinidadian and Tobagonian (30.9%, a difference of 0.15%), Immigrants from Taiwan (31.0%, a difference of 0.19%), and Immigrants from Dominican Republic (31.1%, a difference of 0.35%).
| Demographics | Rating | Rank | In Labor Force | Age 16-19 |
| Immigrants | Caribbean | 0.0 /100 | #323 | Tragic 31.2% |
| Dominicans | 0.0 /100 | #324 | Tragic 31.2% |
| Immigrants | China | 0.0 /100 | #325 | Tragic 31.1% |
| Immigrants | Dominican Republic | 0.0 /100 | #326 | Tragic 31.1% |
| Immigrants | Taiwan | 0.0 /100 | #327 | Tragic 31.0% |
| Immigrants | Ecuador | 0.0 /100 | #328 | Tragic 31.0% |
| Barbadians | 0.0 /100 | #329 | Tragic 31.0% |
| Lumbee | 0.0 /100 | #330 | Tragic 31.0% |
| Trinidadians and Tobagonians | 0.0 /100 | #331 | Tragic 30.9% |
| Immigrants | Israel | 0.0 /100 | #332 | Tragic 30.5% |
| Immigrants | Hong Kong | 0.0 /100 | #333 | Tragic 30.5% |
| Puerto Ricans | 0.0 /100 | #334 | Tragic 30.3% |
| Immigrants | Cuba | 0.0 /100 | #335 | Tragic 30.2% |
| Immigrants | Trinidad and Tobago | 0.0 /100 | #336 | Tragic 30.2% |
| Immigrants | Bangladesh | 0.0 /100 | #337 | Tragic 30.0% |