Hmong vs Immigrants from Switzerland In Labor Force | Age 16-19
COMPARE
Hmong
Immigrants from Switzerland
In Labor Force | Age 16-19
In Labor Force | Age 16-19 Comparison
Hmong
Immigrants from Switzerland
38.7%
IN LABOR FORCE | AGE 16-19
99.1/ 100
METRIC RATING
101st/ 347
METRIC RANK
35.6%
IN LABOR FORCE | AGE 16-19
11.9/ 100
METRIC RATING
210th/ 347
METRIC RANK
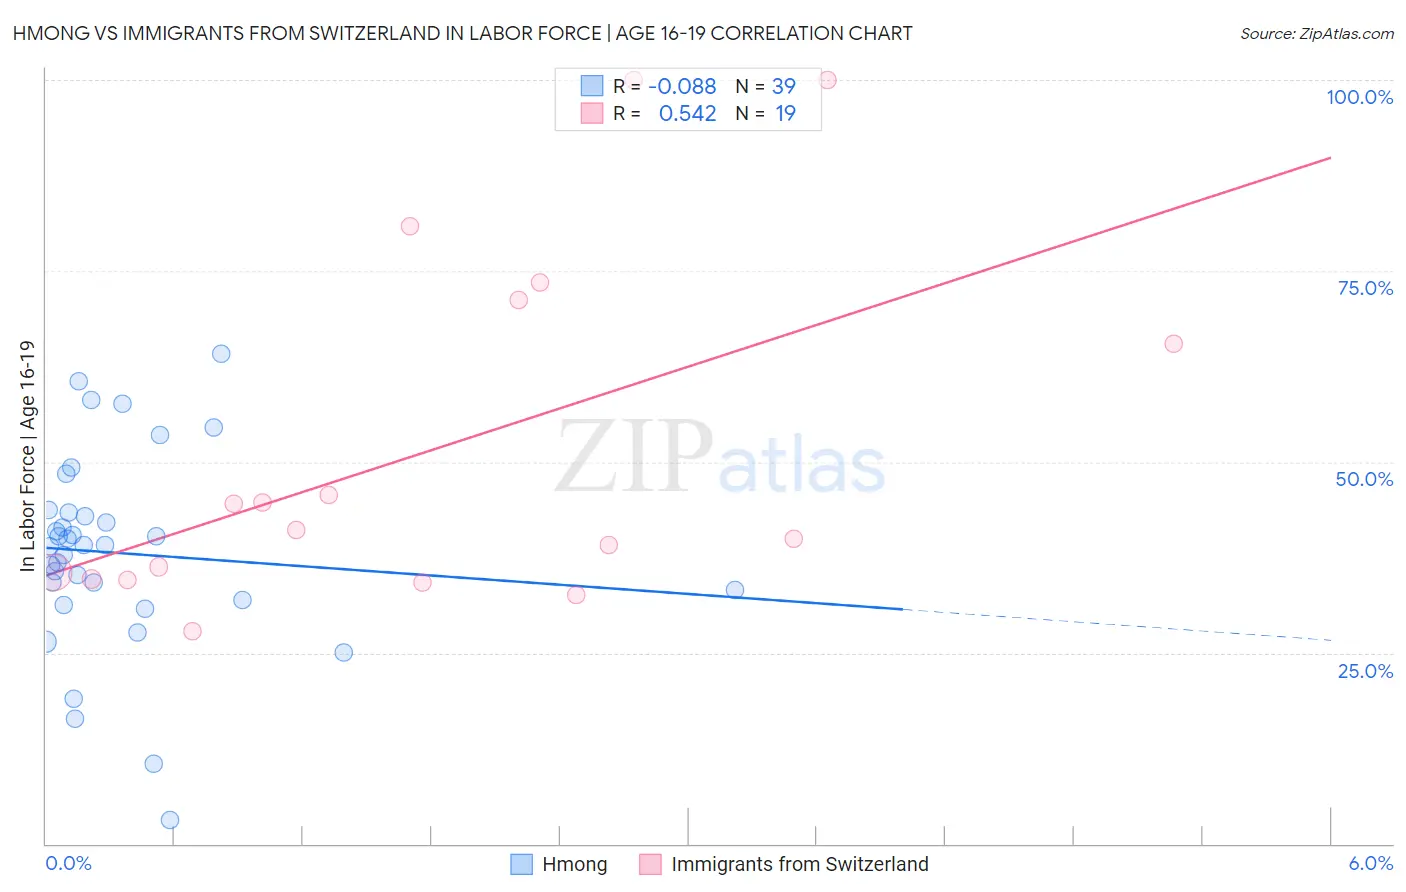
Hmong vs Immigrants from Switzerland In Labor Force | Age 16-19 Correlation Chart
The statistical analysis conducted on geographies consisting of 24,681,034 people shows a slight negative correlation between the proportion of Hmong and labor force participation rate among population between the ages 16 and 19 in the United States with a correlation coefficient (R) of -0.088 and weighted average of 38.7%. Similarly, the statistical analysis conducted on geographies consisting of 147,934,864 people shows a substantial positive correlation between the proportion of Immigrants from Switzerland and labor force participation rate among population between the ages 16 and 19 in the United States with a correlation coefficient (R) of 0.542 and weighted average of 35.6%, a difference of 8.6%.
In Labor Force | Age 16-19 Correlation Summary
| Measurement | Hmong | Immigrants from Switzerland |
| Minimum | 3.1% | 27.7% |
| Maximum | 64.2% | 100.0% |
| Range | 61.1% | 72.3% |
| Mean | 38.1% | 51.7% |
| Median | 39.1% | 41.0% |
| Interquartile 25% (IQ1) | 31.9% | 34.7% |
| Interquartile 75% (IQ3) | 43.4% | 71.2% |
| Interquartile Range (IQR) | 11.5% | 36.5% |
| Standard Deviation (Sample) | 12.9% | 22.9% |
| Standard Deviation (Population) | 12.7% | 22.3% |
Similar Demographics by In Labor Force | Age 16-19
Demographics Similar to Hmong by In Labor Force | Age 16-19
In terms of in labor force | age 16-19, the demographic groups most similar to Hmong are Zimbabwean (38.7%, a difference of 0.010%), Immigrants from Cameroon (38.7%, a difference of 0.040%), Immigrants from Thailand (38.7%, a difference of 0.070%), Immigrants from Eritrea (38.7%, a difference of 0.090%), and Iraqi (38.6%, a difference of 0.25%).
| Demographics | Rating | Rank | In Labor Force | Age 16-19 |
| Immigrants | Canada | 99.4 /100 | #94 | Exceptional 38.9% |
| Immigrants | North America | 99.4 /100 | #95 | Exceptional 38.9% |
| Latvians | 99.4 /100 | #96 | Exceptional 38.9% |
| Greeks | 99.3 /100 | #97 | Exceptional 38.9% |
| Ugandans | 99.3 /100 | #98 | Exceptional 38.9% |
| Immigrants | North Macedonia | 99.3 /100 | #99 | Exceptional 38.9% |
| Immigrants | Thailand | 99.1 /100 | #100 | Exceptional 38.7% |
| Hmong | 99.1 /100 | #101 | Exceptional 38.7% |
| Zimbabweans | 99.1 /100 | #102 | Exceptional 38.7% |
| Immigrants | Cameroon | 99.0 /100 | #103 | Exceptional 38.7% |
| Immigrants | Eritrea | 99.0 /100 | #104 | Exceptional 38.7% |
| Iraqis | 98.9 /100 | #105 | Exceptional 38.6% |
| Delaware | 98.8 /100 | #106 | Exceptional 38.6% |
| Chinese | 98.8 /100 | #107 | Exceptional 38.6% |
| Immigrants | Ethiopia | 98.7 /100 | #108 | Exceptional 38.6% |
Demographics Similar to Immigrants from Switzerland by In Labor Force | Age 16-19
In terms of in labor force | age 16-19, the demographic groups most similar to Immigrants from Switzerland are Mexican (35.6%, a difference of 0.0%), Moroccan (35.7%, a difference of 0.10%), Houma (35.6%, a difference of 0.11%), Immigrants from Bolivia (35.6%, a difference of 0.11%), and Apache (35.6%, a difference of 0.12%).
| Demographics | Rating | Rank | In Labor Force | Age 16-19 |
| Immigrants | Nigeria | 16.8 /100 | #203 | Poor 35.8% |
| Immigrants | Albania | 15.0 /100 | #204 | Poor 35.8% |
| South American Indians | 14.6 /100 | #205 | Poor 35.8% |
| Chileans | 14.6 /100 | #206 | Poor 35.8% |
| Immigrants | Eastern Europe | 14.5 /100 | #207 | Poor 35.8% |
| Koreans | 13.3 /100 | #208 | Poor 35.7% |
| Moroccans | 12.7 /100 | #209 | Poor 35.7% |
| Immigrants | Switzerland | 11.9 /100 | #210 | Poor 35.6% |
| Mexicans | 11.9 /100 | #211 | Poor 35.6% |
| Houma | 11.0 /100 | #212 | Poor 35.6% |
| Immigrants | Bolivia | 11.0 /100 | #213 | Poor 35.6% |
| Apache | 11.0 /100 | #214 | Poor 35.6% |
| Immigrants | South Eastern Asia | 10.8 /100 | #215 | Poor 35.6% |
| Dutch West Indians | 10.7 /100 | #216 | Poor 35.6% |
| Immigrants | Costa Rica | 10.7 /100 | #217 | Poor 35.6% |