Hmong vs Immigrants from Afghanistan In Labor Force | Age 16-19
COMPARE
Hmong
Immigrants from Afghanistan
In Labor Force | Age 16-19
In Labor Force | Age 16-19 Comparison
Hmong
Immigrants from Afghanistan
38.7%
IN LABOR FORCE | AGE 16-19
99.1/ 100
METRIC RATING
101st/ 347
METRIC RANK
36.3%
IN LABOR FORCE | AGE 16-19
34.0/ 100
METRIC RATING
187th/ 347
METRIC RANK
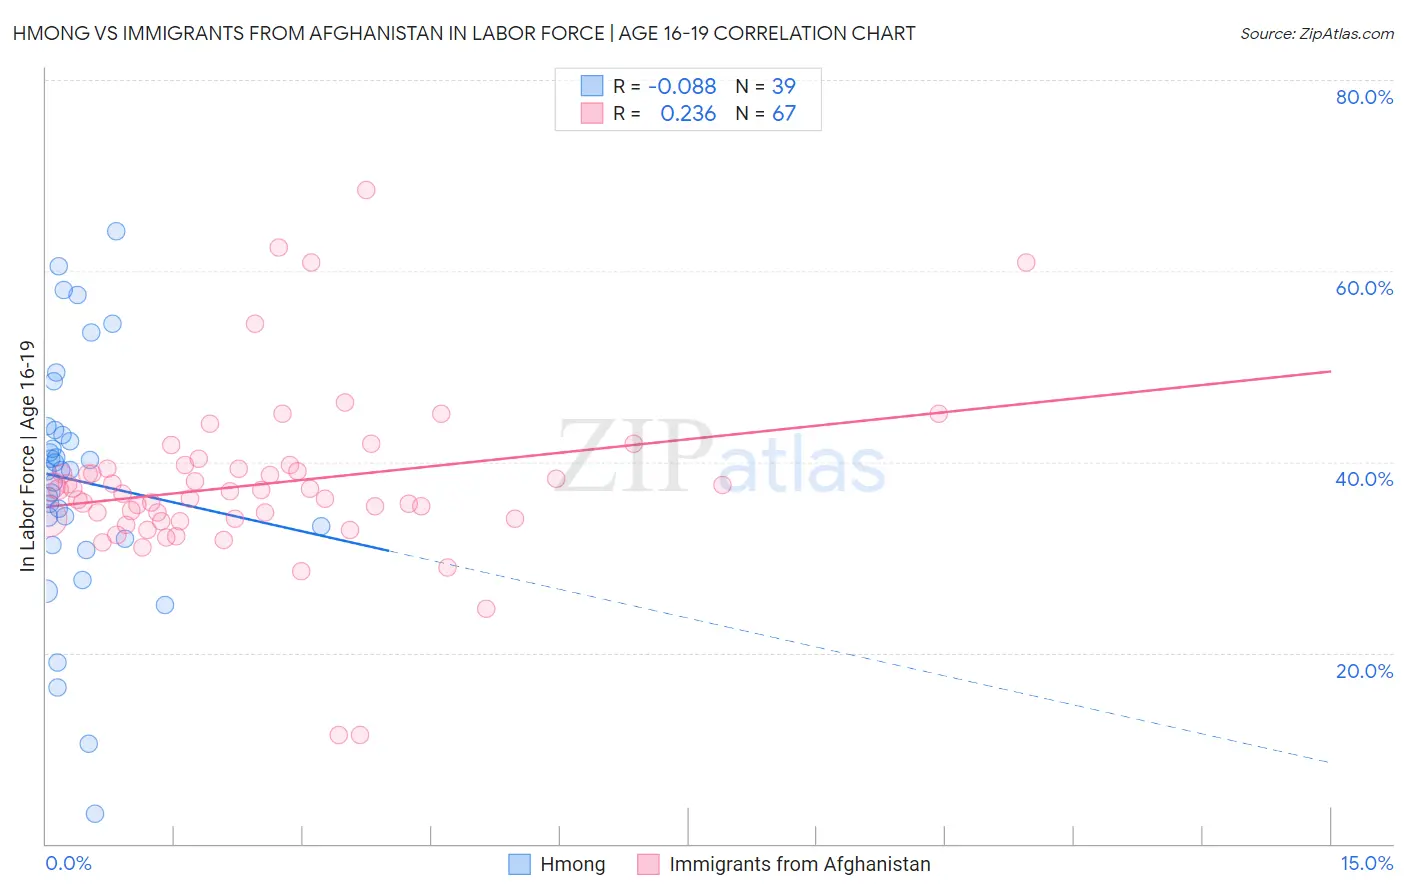
Hmong vs Immigrants from Afghanistan In Labor Force | Age 16-19 Correlation Chart
The statistical analysis conducted on geographies consisting of 24,681,034 people shows a slight negative correlation between the proportion of Hmong and labor force participation rate among population between the ages 16 and 19 in the United States with a correlation coefficient (R) of -0.088 and weighted average of 38.7%. Similarly, the statistical analysis conducted on geographies consisting of 147,514,090 people shows a weak positive correlation between the proportion of Immigrants from Afghanistan and labor force participation rate among population between the ages 16 and 19 in the United States with a correlation coefficient (R) of 0.236 and weighted average of 36.3%, a difference of 6.8%.
In Labor Force | Age 16-19 Correlation Summary
| Measurement | Hmong | Immigrants from Afghanistan |
| Minimum | 3.1% | 11.4% |
| Maximum | 64.2% | 68.5% |
| Range | 61.1% | 57.1% |
| Mean | 38.1% | 37.7% |
| Median | 39.1% | 36.9% |
| Interquartile 25% (IQ1) | 31.9% | 34.0% |
| Interquartile 75% (IQ3) | 43.4% | 39.3% |
| Interquartile Range (IQR) | 11.5% | 5.3% |
| Standard Deviation (Sample) | 12.9% | 9.0% |
| Standard Deviation (Population) | 12.7% | 9.0% |
Similar Demographics by In Labor Force | Age 16-19
Demographics Similar to Hmong by In Labor Force | Age 16-19
In terms of in labor force | age 16-19, the demographic groups most similar to Hmong are Zimbabwean (38.7%, a difference of 0.010%), Immigrants from Cameroon (38.7%, a difference of 0.040%), Immigrants from Thailand (38.7%, a difference of 0.070%), Immigrants from Eritrea (38.7%, a difference of 0.090%), and Iraqi (38.6%, a difference of 0.25%).
| Demographics | Rating | Rank | In Labor Force | Age 16-19 |
| Immigrants | Canada | 99.4 /100 | #94 | Exceptional 38.9% |
| Immigrants | North America | 99.4 /100 | #95 | Exceptional 38.9% |
| Latvians | 99.4 /100 | #96 | Exceptional 38.9% |
| Greeks | 99.3 /100 | #97 | Exceptional 38.9% |
| Ugandans | 99.3 /100 | #98 | Exceptional 38.9% |
| Immigrants | North Macedonia | 99.3 /100 | #99 | Exceptional 38.9% |
| Immigrants | Thailand | 99.1 /100 | #100 | Exceptional 38.7% |
| Hmong | 99.1 /100 | #101 | Exceptional 38.7% |
| Zimbabweans | 99.1 /100 | #102 | Exceptional 38.7% |
| Immigrants | Cameroon | 99.0 /100 | #103 | Exceptional 38.7% |
| Immigrants | Eritrea | 99.0 /100 | #104 | Exceptional 38.7% |
| Iraqis | 98.9 /100 | #105 | Exceptional 38.6% |
| Delaware | 98.8 /100 | #106 | Exceptional 38.6% |
| Chinese | 98.8 /100 | #107 | Exceptional 38.6% |
| Immigrants | Ethiopia | 98.7 /100 | #108 | Exceptional 38.6% |
Demographics Similar to Immigrants from Afghanistan by In Labor Force | Age 16-19
In terms of in labor force | age 16-19, the demographic groups most similar to Immigrants from Afghanistan are Immigrants from Romania (36.3%, a difference of 0.0%), Bhutanese (36.3%, a difference of 0.080%), Costa Rican (36.3%, a difference of 0.12%), Immigrants from Europe (36.2%, a difference of 0.13%), and Eastern European (36.4%, a difference of 0.27%).
| Demographics | Rating | Rank | In Labor Force | Age 16-19 |
| Immigrants | Morocco | 41.1 /100 | #180 | Average 36.4% |
| Jordanians | 39.6 /100 | #181 | Fair 36.4% |
| Immigrants | Italy | 39.1 /100 | #182 | Fair 36.4% |
| Eastern Europeans | 38.8 /100 | #183 | Fair 36.4% |
| Costa Ricans | 36.1 /100 | #184 | Fair 36.3% |
| Bhutanese | 35.3 /100 | #185 | Fair 36.3% |
| Immigrants | Romania | 34.0 /100 | #186 | Fair 36.3% |
| Immigrants | Afghanistan | 34.0 /100 | #187 | Fair 36.3% |
| Immigrants | Europe | 31.8 /100 | #188 | Fair 36.2% |
| Immigrants | Hungary | 28.8 /100 | #189 | Fair 36.2% |
| Panamanians | 28.6 /100 | #190 | Fair 36.1% |
| Immigrants | Croatia | 27.5 /100 | #191 | Fair 36.1% |
| Afghans | 25.7 /100 | #192 | Fair 36.1% |
| Immigrants | Denmark | 25.0 /100 | #193 | Fair 36.1% |
| Nigerians | 24.6 /100 | #194 | Fair 36.1% |