Yaqui vs Immigrants from Canada In Labor Force | Age 16-19
COMPARE
Yaqui
Immigrants from Canada
In Labor Force | Age 16-19
In Labor Force | Age 16-19 Comparison
Yaqui
Immigrants from Canada
37.1%
IN LABOR FORCE | AGE 16-19
74.4/ 100
METRIC RATING
159th/ 347
METRIC RANK
38.9%
IN LABOR FORCE | AGE 16-19
99.4/ 100
METRIC RATING
94th/ 347
METRIC RANK
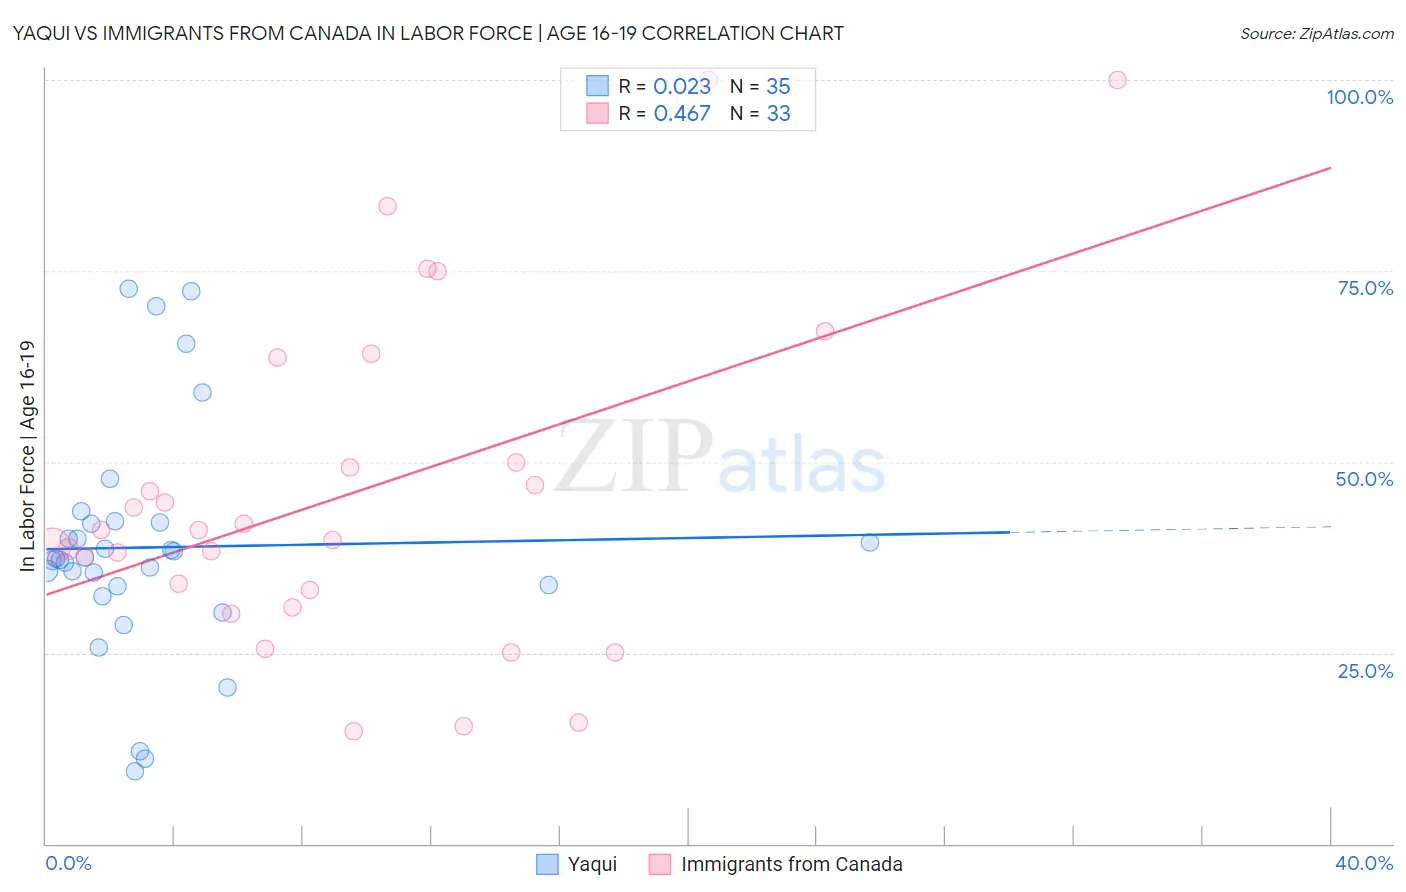
Yaqui vs Immigrants from Canada In Labor Force | Age 16-19 Correlation Chart
The statistical analysis conducted on geographies consisting of 107,656,749 people shows no correlation between the proportion of Yaqui and labor force participation rate among population between the ages 16 and 19 in the United States with a correlation coefficient (R) of 0.023 and weighted average of 37.1%. Similarly, the statistical analysis conducted on geographies consisting of 458,098,188 people shows a moderate positive correlation between the proportion of Immigrants from Canada and labor force participation rate among population between the ages 16 and 19 in the United States with a correlation coefficient (R) of 0.467 and weighted average of 38.9%, a difference of 5.1%.
In Labor Force | Age 16-19 Correlation Summary
| Measurement | Yaqui | Immigrants from Canada |
| Minimum | 9.5% | 14.7% |
| Maximum | 72.6% | 100.0% |
| Range | 63.1% | 85.3% |
| Mean | 38.8% | 45.9% |
| Median | 37.3% | 41.0% |
| Interquartile 25% (IQ1) | 33.7% | 32.1% |
| Interquartile 75% (IQ3) | 42.1% | 56.8% |
| Interquartile Range (IQR) | 8.4% | 24.7% |
| Standard Deviation (Sample) | 15.0% | 21.9% |
| Standard Deviation (Population) | 14.8% | 21.6% |
Similar Demographics by In Labor Force | Age 16-19
Demographics Similar to Yaqui by In Labor Force | Age 16-19
In terms of in labor force | age 16-19, the demographic groups most similar to Yaqui are Immigrants from Saudi Arabia (37.0%, a difference of 0.030%), Ute (37.1%, a difference of 0.080%), Immigrants from Brazil (37.1%, a difference of 0.14%), Cambodian (37.0%, a difference of 0.18%), and Immigrants from Jordan (36.9%, a difference of 0.31%).
| Demographics | Rating | Rank | In Labor Force | Age 16-19 |
| Immigrants | Sierra Leone | 83.6 /100 | #152 | Excellent 37.3% |
| Arapaho | 81.8 /100 | #153 | Excellent 37.3% |
| Immigrants | Bulgaria | 81.6 /100 | #154 | Excellent 37.3% |
| Immigrants | Lithuania | 80.7 /100 | #155 | Excellent 37.2% |
| Kiowa | 80.4 /100 | #156 | Excellent 37.2% |
| Immigrants | Brazil | 76.5 /100 | #157 | Good 37.1% |
| Ute | 75.7 /100 | #158 | Good 37.1% |
| Yaqui | 74.4 /100 | #159 | Good 37.1% |
| Immigrants | Saudi Arabia | 73.9 /100 | #160 | Good 37.0% |
| Cambodians | 71.5 /100 | #161 | Good 37.0% |
| Immigrants | Jordan | 69.5 /100 | #162 | Good 36.9% |
| Bermudans | 69.3 /100 | #163 | Good 36.9% |
| Immigrants | Kuwait | 68.9 /100 | #164 | Good 36.9% |
| Yakama | 66.9 /100 | #165 | Good 36.9% |
| Immigrants | Western Africa | 66.7 /100 | #166 | Good 36.9% |
Demographics Similar to Immigrants from Canada by In Labor Force | Age 16-19
In terms of in labor force | age 16-19, the demographic groups most similar to Immigrants from Canada are Blackfeet (38.9%, a difference of 0.010%), Osage (39.0%, a difference of 0.060%), Immigrants from North America (38.9%, a difference of 0.090%), Latvian (38.9%, a difference of 0.12%), and Spanish American (39.0%, a difference of 0.15%).
| Demographics | Rating | Rank | In Labor Force | Age 16-19 |
| Immigrants | Germany | 99.6 /100 | #87 | Exceptional 39.1% |
| Puget Sound Salish | 99.6 /100 | #88 | Exceptional 39.1% |
| Alaska Natives | 99.6 /100 | #89 | Exceptional 39.1% |
| Immigrants | Burma/Myanmar | 99.5 /100 | #90 | Exceptional 39.0% |
| Spanish Americans | 99.5 /100 | #91 | Exceptional 39.0% |
| Osage | 99.4 /100 | #92 | Exceptional 39.0% |
| Blackfeet | 99.4 /100 | #93 | Exceptional 38.9% |
| Immigrants | Canada | 99.4 /100 | #94 | Exceptional 38.9% |
| Immigrants | North America | 99.4 /100 | #95 | Exceptional 38.9% |
| Latvians | 99.4 /100 | #96 | Exceptional 38.9% |
| Greeks | 99.3 /100 | #97 | Exceptional 38.9% |
| Ugandans | 99.3 /100 | #98 | Exceptional 38.9% |
| Immigrants | North Macedonia | 99.3 /100 | #99 | Exceptional 38.9% |
| Immigrants | Thailand | 99.1 /100 | #100 | Exceptional 38.7% |
| Hmong | 99.1 /100 | #101 | Exceptional 38.7% |