Immigrants from Southern Europe vs Immigrants from Belarus In Labor Force | Age 16-19
COMPARE
Immigrants from Southern Europe
Immigrants from Belarus
In Labor Force | Age 16-19
In Labor Force | Age 16-19 Comparison
Immigrants from Southern Europe
Immigrants from Belarus
36.4%
IN LABOR FORCE | AGE 16-19
43.3/ 100
METRIC RATING
179th/ 347
METRIC RANK
33.4%
IN LABOR FORCE | AGE 16-19
0.1/ 100
METRIC RATING
291st/ 347
METRIC RANK
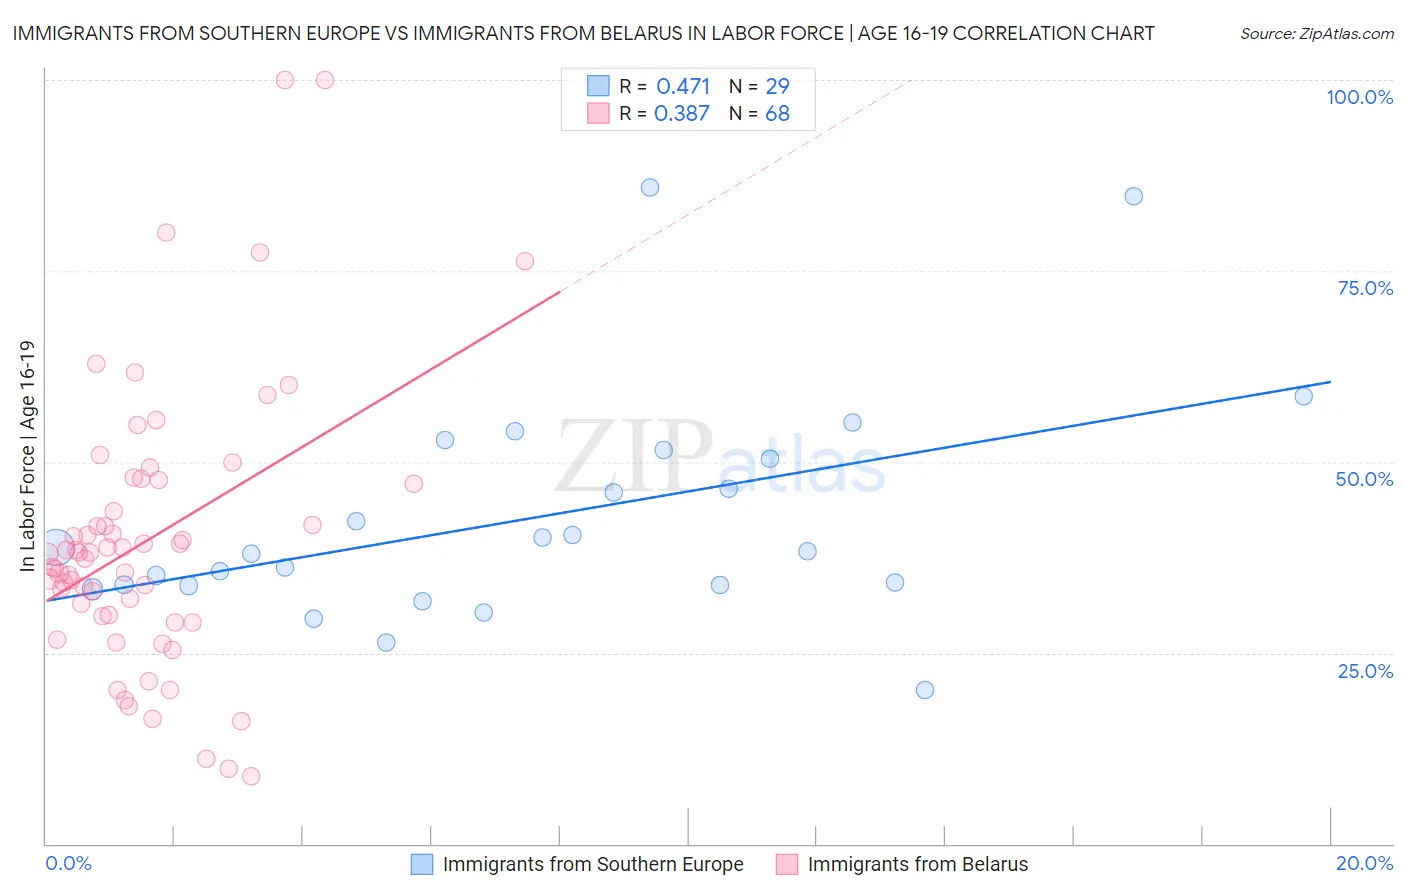
Immigrants from Southern Europe vs Immigrants from Belarus In Labor Force | Age 16-19 Correlation Chart
The statistical analysis conducted on geographies consisting of 401,923,668 people shows a moderate positive correlation between the proportion of Immigrants from Southern Europe and labor force participation rate among population between the ages 16 and 19 in the United States with a correlation coefficient (R) of 0.471 and weighted average of 36.4%. Similarly, the statistical analysis conducted on geographies consisting of 150,086,766 people shows a mild positive correlation between the proportion of Immigrants from Belarus and labor force participation rate among population between the ages 16 and 19 in the United States with a correlation coefficient (R) of 0.387 and weighted average of 33.4%, a difference of 9.0%.
In Labor Force | Age 16-19 Correlation Summary
| Measurement | Immigrants from Southern Europe | Immigrants from Belarus |
| Minimum | 20.1% | 8.8% |
| Maximum | 85.9% | 100.0% |
| Range | 65.8% | 91.2% |
| Mean | 42.7% | 39.8% |
| Median | 38.4% | 38.0% |
| Interquartile 25% (IQ1) | 33.9% | 29.9% |
| Interquartile 75% (IQ3) | 51.0% | 47.4% |
| Interquartile Range (IQR) | 17.1% | 17.5% |
| Standard Deviation (Sample) | 15.0% | 18.1% |
| Standard Deviation (Population) | 14.7% | 17.9% |
Similar Demographics by In Labor Force | Age 16-19
Demographics Similar to Immigrants from Southern Europe by In Labor Force | Age 16-19
In terms of in labor force | age 16-19, the demographic groups most similar to Immigrants from Southern Europe are Black/African American (36.5%, a difference of 0.090%), Immigrants from Morocco (36.4%, a difference of 0.12%), Immigrants from Northern Europe (36.5%, a difference of 0.17%), Jordanian (36.4%, a difference of 0.20%), and Immigrants from Italy (36.4%, a difference of 0.22%).
| Demographics | Rating | Rank | In Labor Force | Age 16-19 |
| South Africans | 58.3 /100 | #172 | Average 36.7% |
| Russians | 57.5 /100 | #173 | Average 36.7% |
| Immigrants | Czechoslovakia | 50.0 /100 | #174 | Average 36.6% |
| Natives/Alaskans | 49.0 /100 | #175 | Average 36.6% |
| Albanians | 48.8 /100 | #176 | Average 36.5% |
| Immigrants | Northern Europe | 46.6 /100 | #177 | Average 36.5% |
| Blacks/African Americans | 45.1 /100 | #178 | Average 36.5% |
| Immigrants | Southern Europe | 43.3 /100 | #179 | Average 36.4% |
| Immigrants | Morocco | 41.1 /100 | #180 | Average 36.4% |
| Jordanians | 39.6 /100 | #181 | Fair 36.4% |
| Immigrants | Italy | 39.1 /100 | #182 | Fair 36.4% |
| Eastern Europeans | 38.8 /100 | #183 | Fair 36.4% |
| Costa Ricans | 36.1 /100 | #184 | Fair 36.3% |
| Bhutanese | 35.3 /100 | #185 | Fair 36.3% |
| Immigrants | Romania | 34.0 /100 | #186 | Fair 36.3% |
Demographics Similar to Immigrants from Belarus by In Labor Force | Age 16-19
In terms of in labor force | age 16-19, the demographic groups most similar to Immigrants from Belarus are Haitian (33.4%, a difference of 0.060%), Immigrants from Colombia (33.5%, a difference of 0.080%), Immigrants from Singapore (33.5%, a difference of 0.21%), Immigrants from Indonesia (33.5%, a difference of 0.22%), and Nepalese (33.5%, a difference of 0.25%).
| Demographics | Rating | Rank | In Labor Force | Age 16-19 |
| Immigrants | Spain | 0.2 /100 | #284 | Tragic 33.7% |
| U.S. Virgin Islanders | 0.2 /100 | #285 | Tragic 33.6% |
| South Americans | 0.2 /100 | #286 | Tragic 33.6% |
| Nepalese | 0.1 /100 | #287 | Tragic 33.5% |
| Immigrants | Indonesia | 0.1 /100 | #288 | Tragic 33.5% |
| Immigrants | Singapore | 0.1 /100 | #289 | Tragic 33.5% |
| Immigrants | Colombia | 0.1 /100 | #290 | Tragic 33.5% |
| Immigrants | Belarus | 0.1 /100 | #291 | Tragic 33.4% |
| Haitians | 0.1 /100 | #292 | Tragic 33.4% |
| Immigrants | South America | 0.1 /100 | #293 | Tragic 33.3% |
| Argentineans | 0.1 /100 | #294 | Tragic 33.3% |
| Yup'ik | 0.1 /100 | #295 | Tragic 33.3% |
| Jamaicans | 0.1 /100 | #296 | Tragic 33.2% |
| Immigrants | Haiti | 0.1 /100 | #297 | Tragic 33.2% |
| Iranians | 0.0 /100 | #298 | Tragic 33.0% |