Liberian vs Immigrants from Belarus In Labor Force | Age 16-19
COMPARE
Liberian
Immigrants from Belarus
In Labor Force | Age 16-19
In Labor Force | Age 16-19 Comparison
Liberians
Immigrants from Belarus
41.8%
IN LABOR FORCE | AGE 16-19
100.0/ 100
METRIC RATING
33rd/ 347
METRIC RANK
33.4%
IN LABOR FORCE | AGE 16-19
0.1/ 100
METRIC RATING
291st/ 347
METRIC RANK
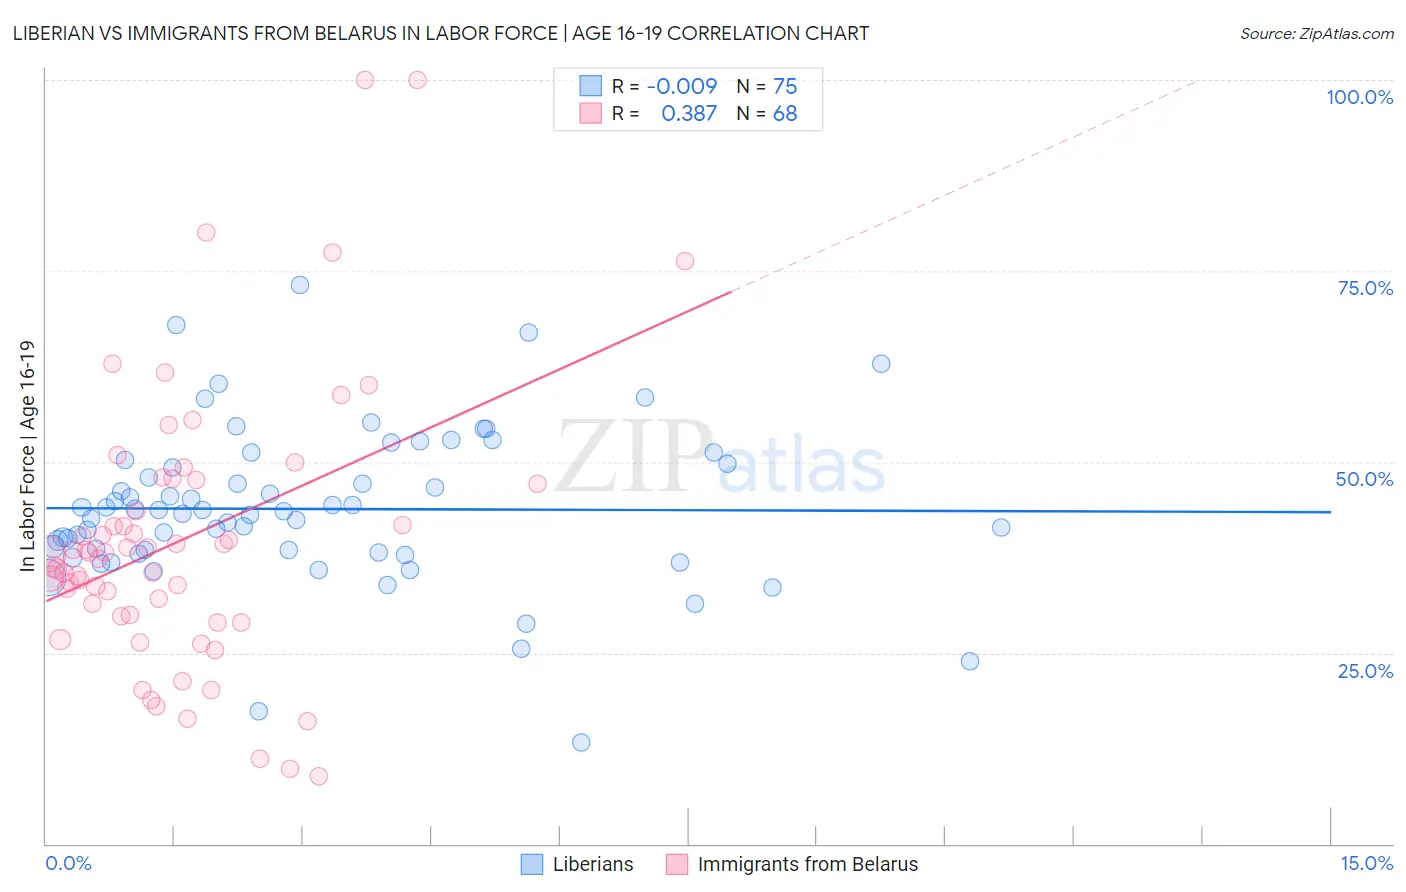
Liberian vs Immigrants from Belarus In Labor Force | Age 16-19 Correlation Chart
The statistical analysis conducted on geographies consisting of 118,043,007 people shows no correlation between the proportion of Liberians and labor force participation rate among population between the ages 16 and 19 in the United States with a correlation coefficient (R) of -0.009 and weighted average of 41.8%. Similarly, the statistical analysis conducted on geographies consisting of 150,086,766 people shows a mild positive correlation between the proportion of Immigrants from Belarus and labor force participation rate among population between the ages 16 and 19 in the United States with a correlation coefficient (R) of 0.387 and weighted average of 33.4%, a difference of 25.1%.
In Labor Force | Age 16-19 Correlation Summary
| Measurement | Liberian | Immigrants from Belarus |
| Minimum | 13.3% | 8.8% |
| Maximum | 73.2% | 100.0% |
| Range | 59.9% | 91.2% |
| Mean | 43.8% | 39.8% |
| Median | 43.6% | 38.0% |
| Interquartile 25% (IQ1) | 38.1% | 29.9% |
| Interquartile 75% (IQ3) | 49.7% | 47.4% |
| Interquartile Range (IQR) | 11.6% | 17.5% |
| Standard Deviation (Sample) | 10.3% | 18.1% |
| Standard Deviation (Population) | 10.2% | 17.9% |
Similar Demographics by In Labor Force | Age 16-19
Demographics Similar to Liberians by In Labor Force | Age 16-19
In terms of in labor force | age 16-19, the demographic groups most similar to Liberians are Immigrants from Bosnia and Herzegovina (41.8%, a difference of 0.080%), Yugoslavian (41.8%, a difference of 0.10%), Czechoslovakian (41.9%, a difference of 0.14%), Immigrants from the Azores (41.7%, a difference of 0.24%), and Immigrants from Congo (41.7%, a difference of 0.32%).
| Demographics | Rating | Rank | In Labor Force | Age 16-19 |
| English | 100.0 /100 | #26 | Exceptional 42.4% |
| Welsh | 100.0 /100 | #27 | Exceptional 42.3% |
| Poles | 100.0 /100 | #28 | Exceptional 42.1% |
| French | 100.0 /100 | #29 | Exceptional 42.1% |
| Scottish | 100.0 /100 | #30 | Exceptional 42.0% |
| Irish | 100.0 /100 | #31 | Exceptional 42.0% |
| Czechoslovakians | 100.0 /100 | #32 | Exceptional 41.9% |
| Liberians | 100.0 /100 | #33 | Exceptional 41.8% |
| Immigrants | Bosnia and Herzegovina | 100.0 /100 | #34 | Exceptional 41.8% |
| Yugoslavians | 100.0 /100 | #35 | Exceptional 41.8% |
| Immigrants | Azores | 100.0 /100 | #36 | Exceptional 41.7% |
| Immigrants | Congo | 100.0 /100 | #37 | Exceptional 41.7% |
| Sioux | 100.0 /100 | #38 | Exceptional 41.5% |
| Scotch-Irish | 100.0 /100 | #39 | Exceptional 41.5% |
| Immigrants | Liberia | 100.0 /100 | #40 | Exceptional 41.5% |
Demographics Similar to Immigrants from Belarus by In Labor Force | Age 16-19
In terms of in labor force | age 16-19, the demographic groups most similar to Immigrants from Belarus are Haitian (33.4%, a difference of 0.060%), Immigrants from Colombia (33.5%, a difference of 0.080%), Immigrants from Singapore (33.5%, a difference of 0.21%), Immigrants from Indonesia (33.5%, a difference of 0.22%), and Nepalese (33.5%, a difference of 0.25%).
| Demographics | Rating | Rank | In Labor Force | Age 16-19 |
| Immigrants | Spain | 0.2 /100 | #284 | Tragic 33.7% |
| U.S. Virgin Islanders | 0.2 /100 | #285 | Tragic 33.6% |
| South Americans | 0.2 /100 | #286 | Tragic 33.6% |
| Nepalese | 0.1 /100 | #287 | Tragic 33.5% |
| Immigrants | Indonesia | 0.1 /100 | #288 | Tragic 33.5% |
| Immigrants | Singapore | 0.1 /100 | #289 | Tragic 33.5% |
| Immigrants | Colombia | 0.1 /100 | #290 | Tragic 33.5% |
| Immigrants | Belarus | 0.1 /100 | #291 | Tragic 33.4% |
| Haitians | 0.1 /100 | #292 | Tragic 33.4% |
| Immigrants | South America | 0.1 /100 | #293 | Tragic 33.3% |
| Argentineans | 0.1 /100 | #294 | Tragic 33.3% |
| Yup'ik | 0.1 /100 | #295 | Tragic 33.3% |
| Jamaicans | 0.1 /100 | #296 | Tragic 33.2% |
| Immigrants | Haiti | 0.1 /100 | #297 | Tragic 33.2% |
| Iranians | 0.0 /100 | #298 | Tragic 33.0% |