Samoan vs German In Labor Force | Age 35-44
COMPARE
Samoan
German
In Labor Force | Age 35-44
In Labor Force | Age 35-44 Comparison
Samoans
Germans
83.2%
IN LABOR FORCE | AGE 35-44
0.0/ 100
METRIC RATING
277th/ 347
METRIC RANK
84.7%
IN LABOR FORCE | AGE 35-44
91.0/ 100
METRIC RATING
122nd/ 347
METRIC RANK
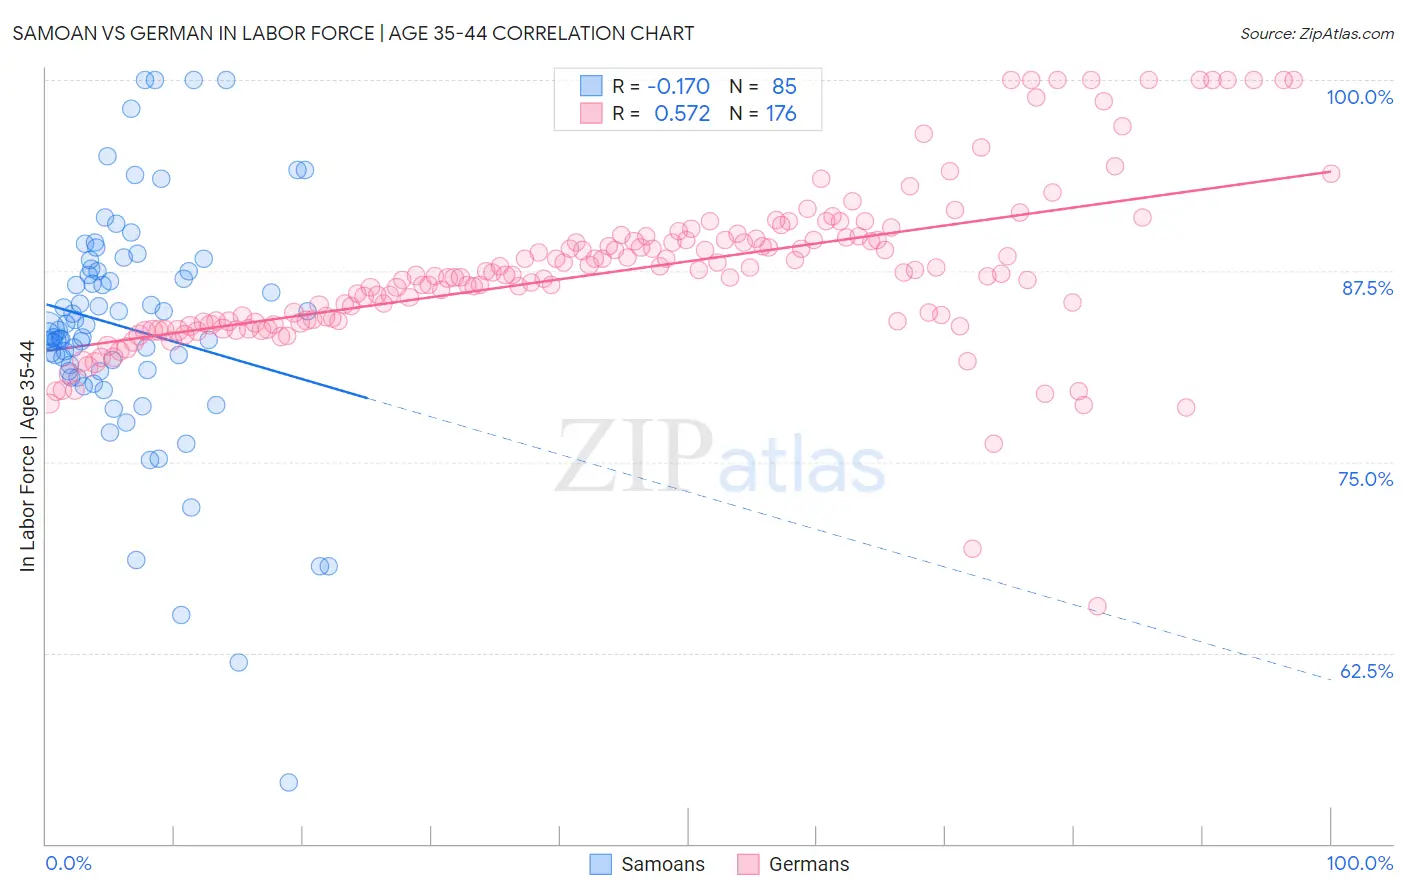
Samoan vs German In Labor Force | Age 35-44 Correlation Chart
The statistical analysis conducted on geographies consisting of 225,132,853 people shows a poor negative correlation between the proportion of Samoans and labor force participation rate among population between the ages 35 and 44 in the United States with a correlation coefficient (R) of -0.170 and weighted average of 83.2%. Similarly, the statistical analysis conducted on geographies consisting of 580,230,467 people shows a substantial positive correlation between the proportion of Germans and labor force participation rate among population between the ages 35 and 44 in the United States with a correlation coefficient (R) of 0.572 and weighted average of 84.7%, a difference of 1.8%.
In Labor Force | Age 35-44 Correlation Summary
| Measurement | Samoan | German |
| Minimum | 54.0% | 65.5% |
| Maximum | 100.0% | 100.0% |
| Range | 46.0% | 34.5% |
| Mean | 83.7% | 87.5% |
| Median | 83.6% | 87.2% |
| Interquartile 25% (IQ1) | 80.9% | 84.1% |
| Interquartile 75% (IQ3) | 87.6% | 89.6% |
| Interquartile Range (IQR) | 6.7% | 5.5% |
| Standard Deviation (Sample) | 7.9% | 5.4% |
| Standard Deviation (Population) | 7.9% | 5.4% |
Similar Demographics by In Labor Force | Age 35-44
Demographics Similar to Samoans by In Labor Force | Age 35-44
In terms of in labor force | age 35-44, the demographic groups most similar to Samoans are Delaware (83.2%, a difference of 0.010%), Hawaiian (83.2%, a difference of 0.020%), Nonimmigrants (83.2%, a difference of 0.030%), Immigrants from Fiji (83.2%, a difference of 0.050%), and Spanish (83.2%, a difference of 0.050%).
| Demographics | Rating | Rank | In Labor Force | Age 35-44 |
| Immigrants | Honduras | 0.0 /100 | #270 | Tragic 83.3% |
| French American Indians | 0.0 /100 | #271 | Tragic 83.2% |
| Immigrants | Fiji | 0.0 /100 | #272 | Tragic 83.2% |
| Spanish | 0.0 /100 | #273 | Tragic 83.2% |
| Immigrants | Nonimmigrants | 0.0 /100 | #274 | Tragic 83.2% |
| Hawaiians | 0.0 /100 | #275 | Tragic 83.2% |
| Delaware | 0.0 /100 | #276 | Tragic 83.2% |
| Samoans | 0.0 /100 | #277 | Tragic 83.2% |
| Belizeans | 0.0 /100 | #278 | Tragic 83.1% |
| Immigrants | Micronesia | 0.0 /100 | #279 | Tragic 83.1% |
| Dominicans | 0.0 /100 | #280 | Tragic 83.1% |
| Guatemalans | 0.0 /100 | #281 | Tragic 83.0% |
| Osage | 0.0 /100 | #282 | Tragic 82.9% |
| Immigrants | Guatemala | 0.0 /100 | #283 | Tragic 82.9% |
| Immigrants | Dominican Republic | 0.0 /100 | #284 | Tragic 82.9% |
Demographics Similar to Germans by In Labor Force | Age 35-44
In terms of in labor force | age 35-44, the demographic groups most similar to Germans are Finnish (84.7%, a difference of 0.0%), Immigrants from South America (84.7%, a difference of 0.0%), Slavic (84.7%, a difference of 0.0%), Burmese (84.7%, a difference of 0.010%), and Immigrants from Northern Europe (84.7%, a difference of 0.010%).
| Demographics | Rating | Rank | In Labor Force | Age 35-44 |
| Bahamians | 93.2 /100 | #115 | Exceptional 84.7% |
| Immigrants | Egypt | 92.7 /100 | #116 | Exceptional 84.7% |
| Immigrants | China | 92.3 /100 | #117 | Exceptional 84.7% |
| Immigrants | Eastern Asia | 92.1 /100 | #118 | Exceptional 84.7% |
| Burmese | 91.8 /100 | #119 | Exceptional 84.7% |
| Immigrants | Northern Europe | 91.5 /100 | #120 | Exceptional 84.7% |
| Finns | 91.2 /100 | #121 | Exceptional 84.7% |
| Germans | 91.0 /100 | #122 | Exceptional 84.7% |
| Immigrants | South America | 90.9 /100 | #123 | Exceptional 84.7% |
| Slavs | 90.8 /100 | #124 | Exceptional 84.7% |
| Maltese | 90.8 /100 | #125 | Exceptional 84.7% |
| Asians | 90.6 /100 | #126 | Exceptional 84.7% |
| Immigrants | Spain | 90.6 /100 | #127 | Exceptional 84.7% |
| Immigrants | Ghana | 90.4 /100 | #128 | Exceptional 84.7% |
| Palestinians | 89.7 /100 | #129 | Excellent 84.7% |